While the client is enrolled in your monitoring program, the SCRAMNET GPS Dashboard will indicate when a non-compliant event has occurred or if there are disruptions in location or communication between the SCRAM GPS bracelet and SCRAMNET GPS. The SCRAMNET GPS Dashboard Overview article outlines the various event icons and behaviors, enabling you to identify events that require your immediate attention quickly. Once you have identified an event that requires action, the Client Profile Summary article details the quick-access dropdown menu, which provides a way to complete specific actions or send commands to the SCRAM GPS bracelet.
In addition to the Dashboard, you may view a record of client events, add a note to the event, or clear an event by selecting the Events Icon on either the client’s quick-access dropdown menu or from the client’s Profile Summary pop-up window.
| Quick Tip
You may also access the Client Events by selecting the colored event dot on the Dashboard. |
This article includes:
Client Events Pop-up Window Overview
Once you have accessed the Client Events pop-up window, you may take several actions.
Pop-up Window Banner
The banner displays the client’s name, last known location information, current communication details by device type, and the current supervision plan associated with the device.

Client Information Banner – click to enlarge
Filter By
Use the filter options to customize the events listed by adding or removing an event category. In addition to the event categories, the filter dropdown menu includes an option to view “Cleared” events. This allows you to view events that have been removed from the Dashboard, either because the event has ended or because a user manually removed it.

Filter Options – click to enlarge
Event Details Table
The Client Events table displays the event’s severity level, a description of the event, the event start time, location information, any added notes, and a list of recipients to whom notifications were sent.
In addition to the list of events, some additional client movements and actions are also listed. For example, a line item is displayed when the client has entered or exited a zone, connected and unplugged the SCRAM GPS bracelet to a charging cable, and whether the client has pressed the acknowledgement button on the bracelet when the device vibrates or produces an audible alarm.
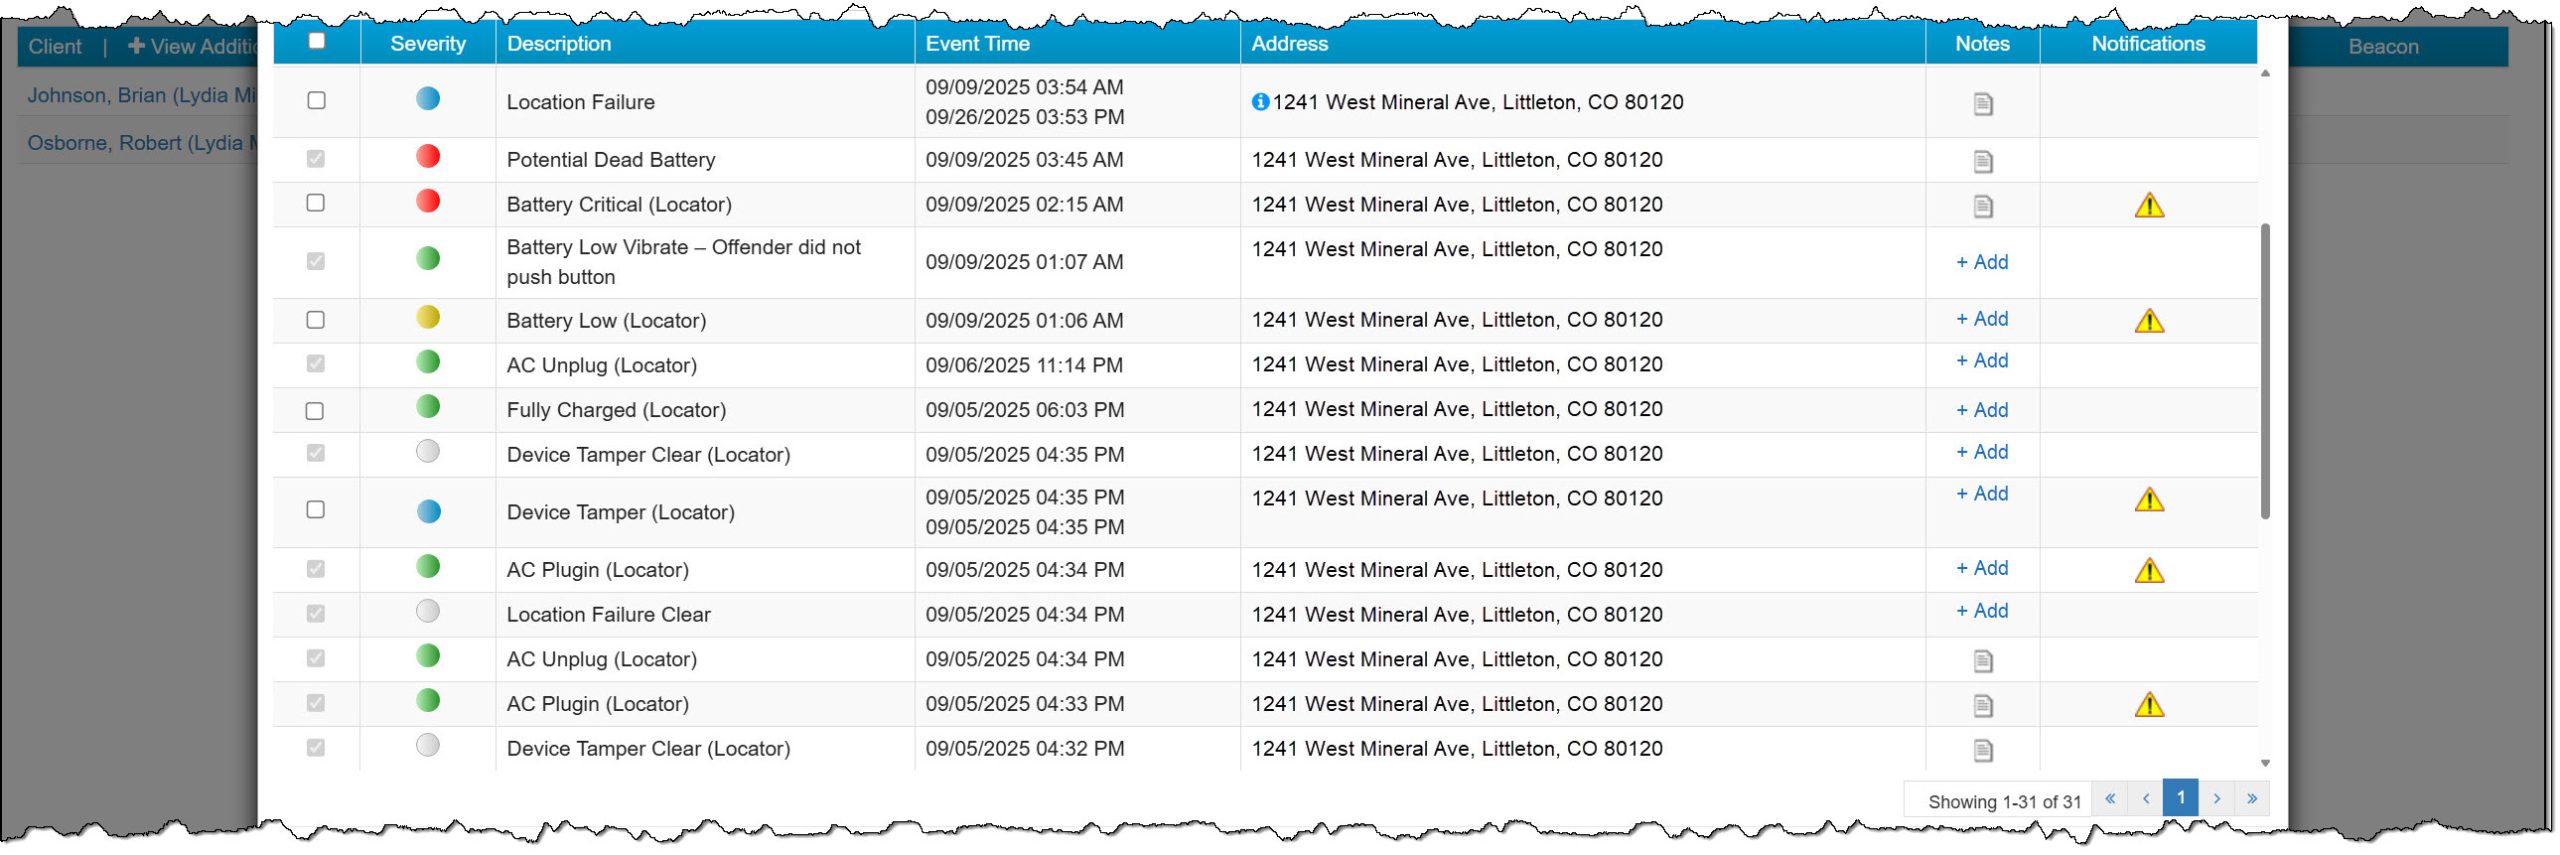
Event Details Table with Multiple Line Items Displayed – click to enlarge
Buttons and Icons
- Hovering your mouse over the “circled up arrow” icon will display a pop-up window with the time zone.
- When making updates to the filter options, select the Go button once your selections are complete to update the listed items.
- Use the Notes, Locate Now, Vibrate, and Audible Alarm quick-access buttons to complete specific actions or send commands to the SCRAM GPS bracelet.
- The “refresh” icon will reload the Client Events page.
- In the Notifications column, select the “caution” icon, which will open a pop-up window displaying a list of recipients to whom a notification was sent.
- To add a note to a checked event, select the Add Event Note button, or in the Notes column, select the +Add hyperlink.
- To view a note recorded for an event, select the “page” icon.
- To clear a checked event from the Dashboard, select the Clear Selected button to proceed.
- To close the Client Events pop-up window, select either the “X” in the upper right corner or the Close button in the lower right corner.
Client Events Pop-up Window Highlighting the Different Icons, Hyperlinks, and Buttons – click to enlarge
Add a Note to an Event
On the Client Events pop-up window:
- Check the box to the left of the line item or items you wish to add a note to.
- After making your selection, select the Add Event Note button, or select the +Add hyperlink located in the Notes column.
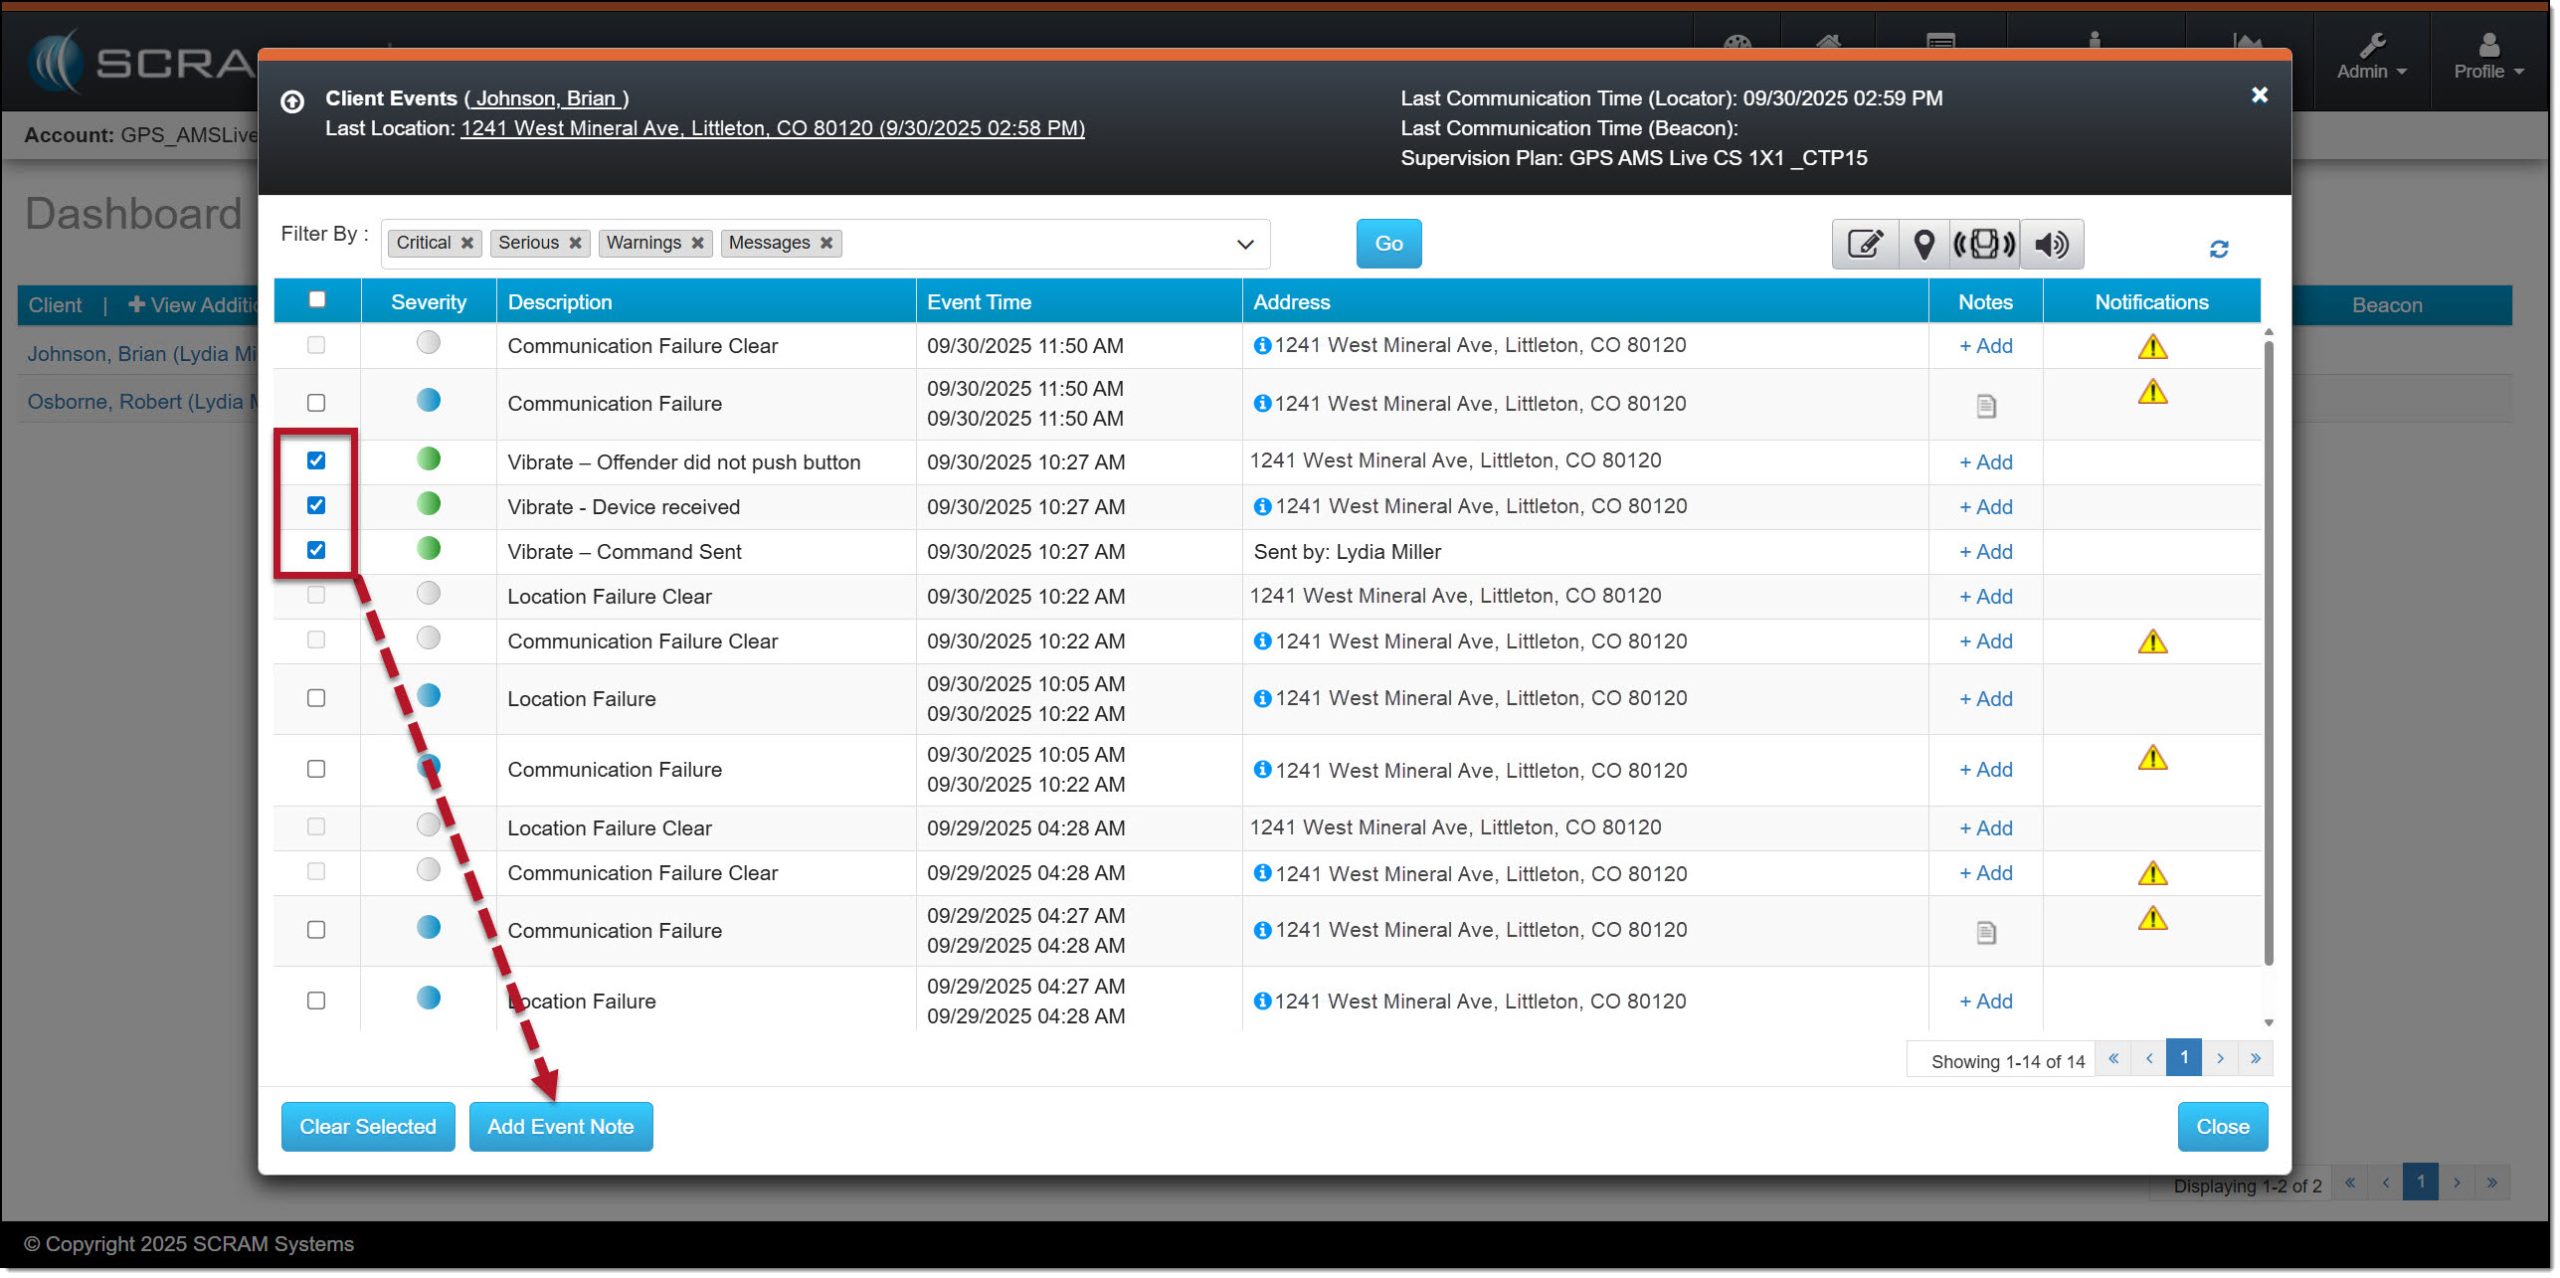
Events Checked, and Add Event Note Button Highlighted – click to enlarge
Quick Tip
|
- On the Enter Event Note pop-up window, enter your note.
- You may elect to send an email to the Primary Agent and “tag this note,” which will add a “page” icon next to the event notification on the Dashboard when applicable by checking the box to the left of each option.
- To save the information, select the Save button.
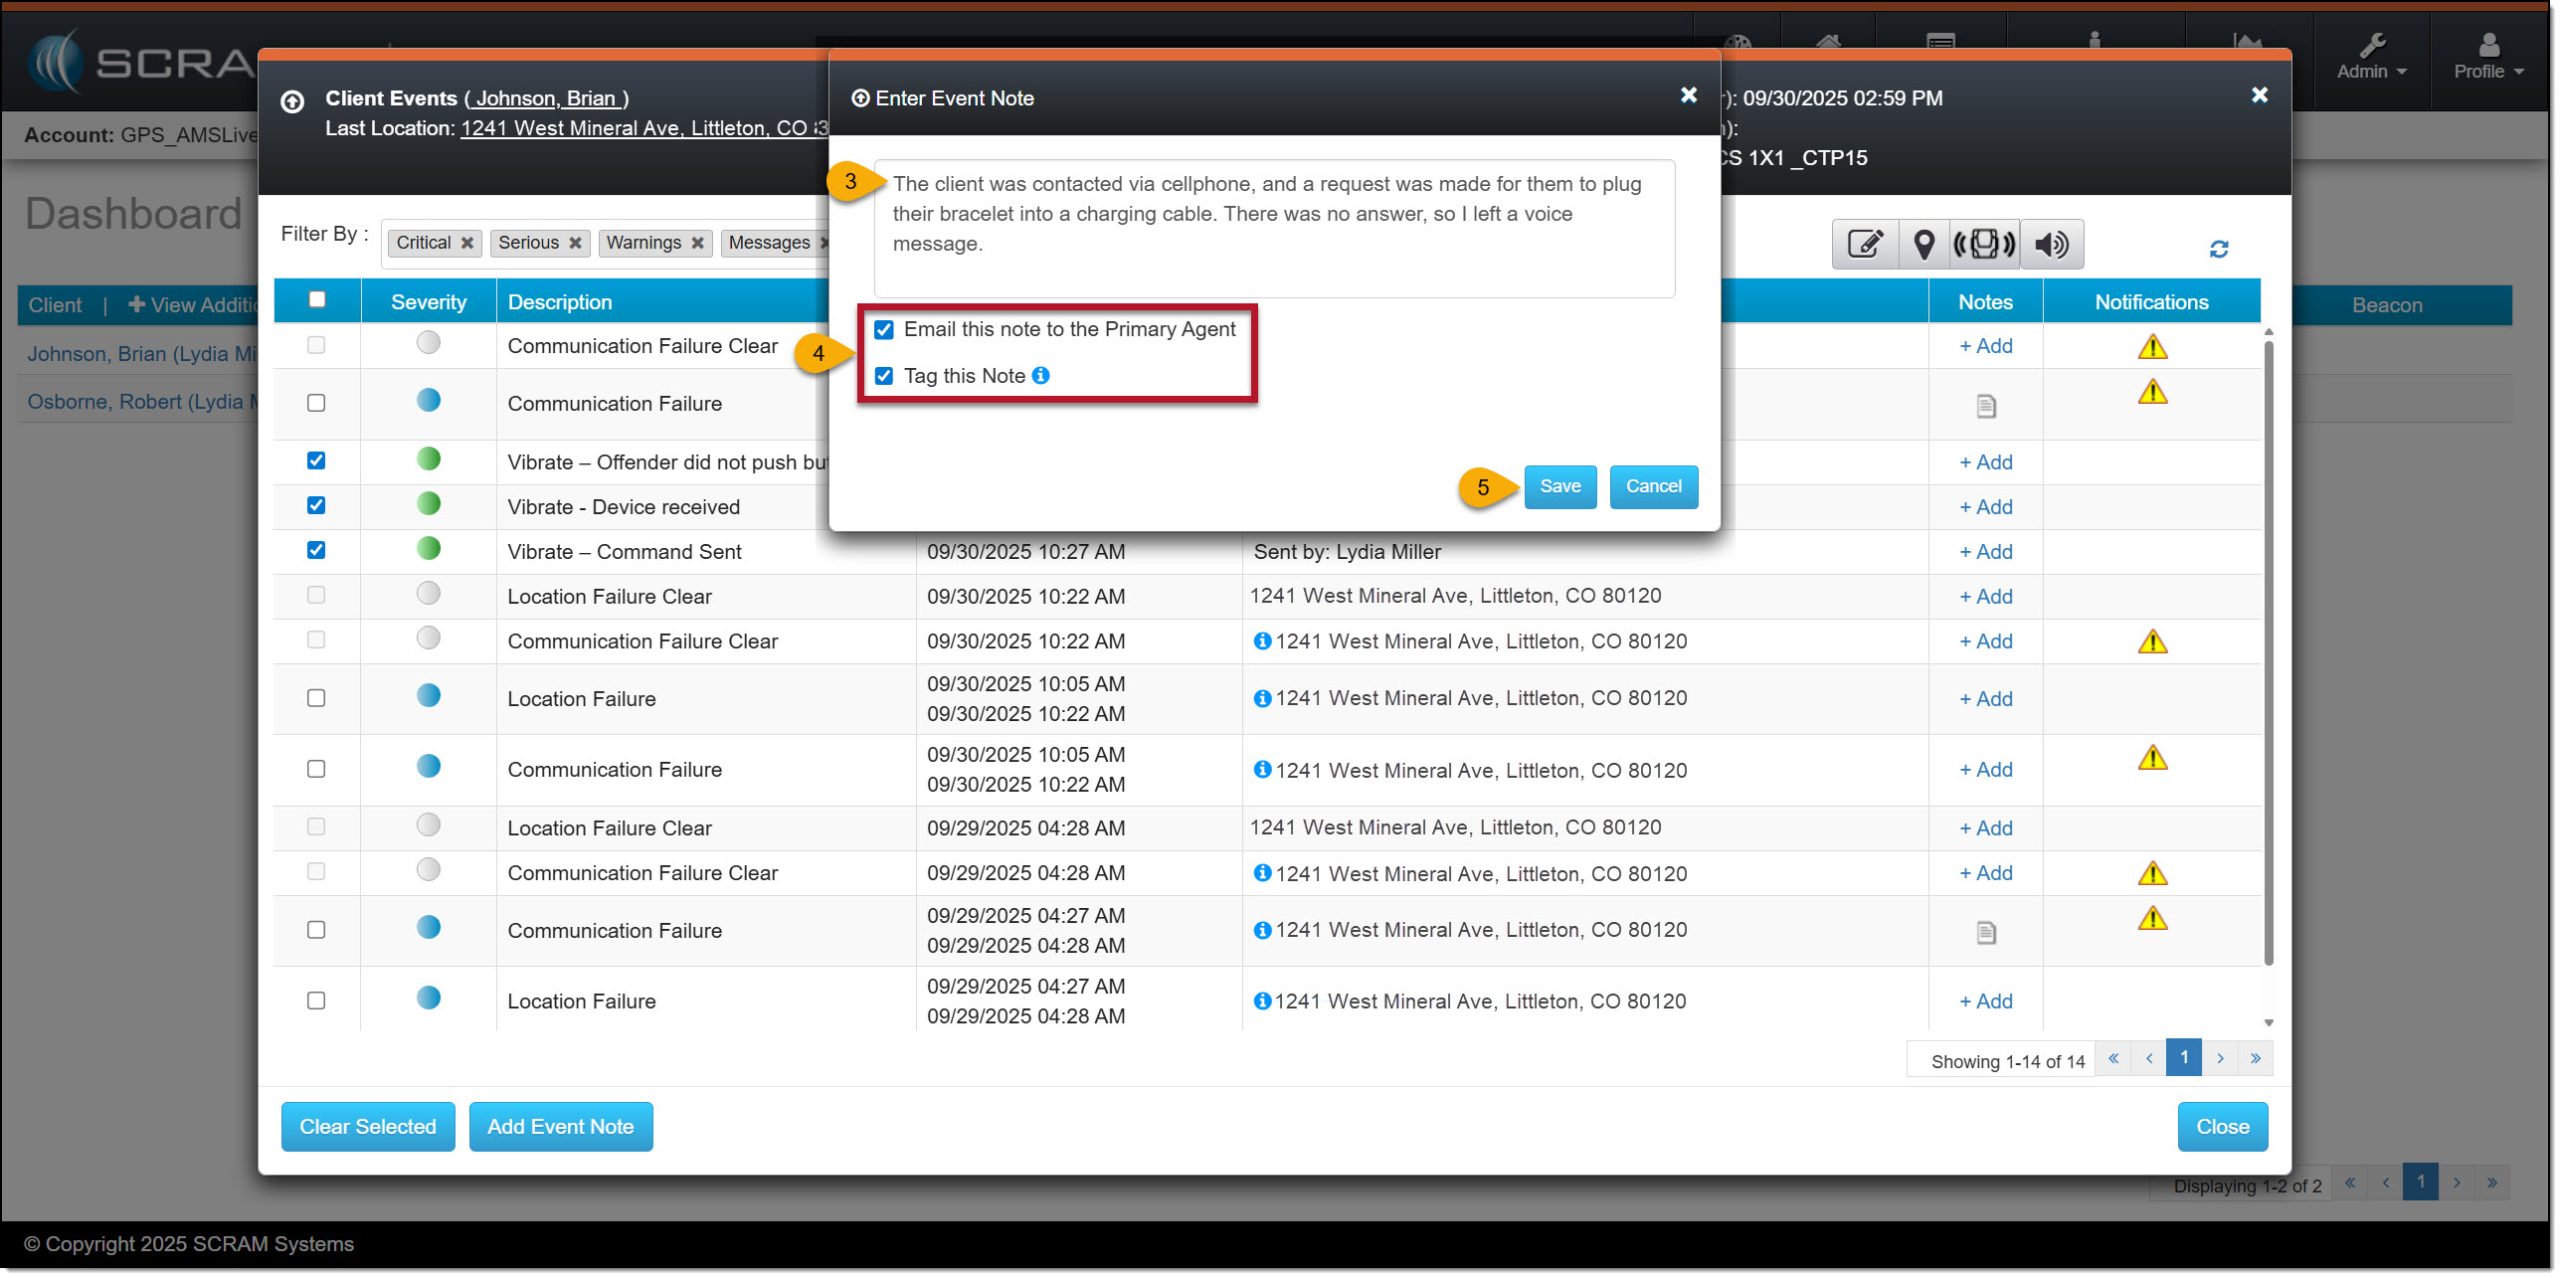
Sample Note Added and Additional Options Selected – click to enlarge
- The last step is to select the OK button.
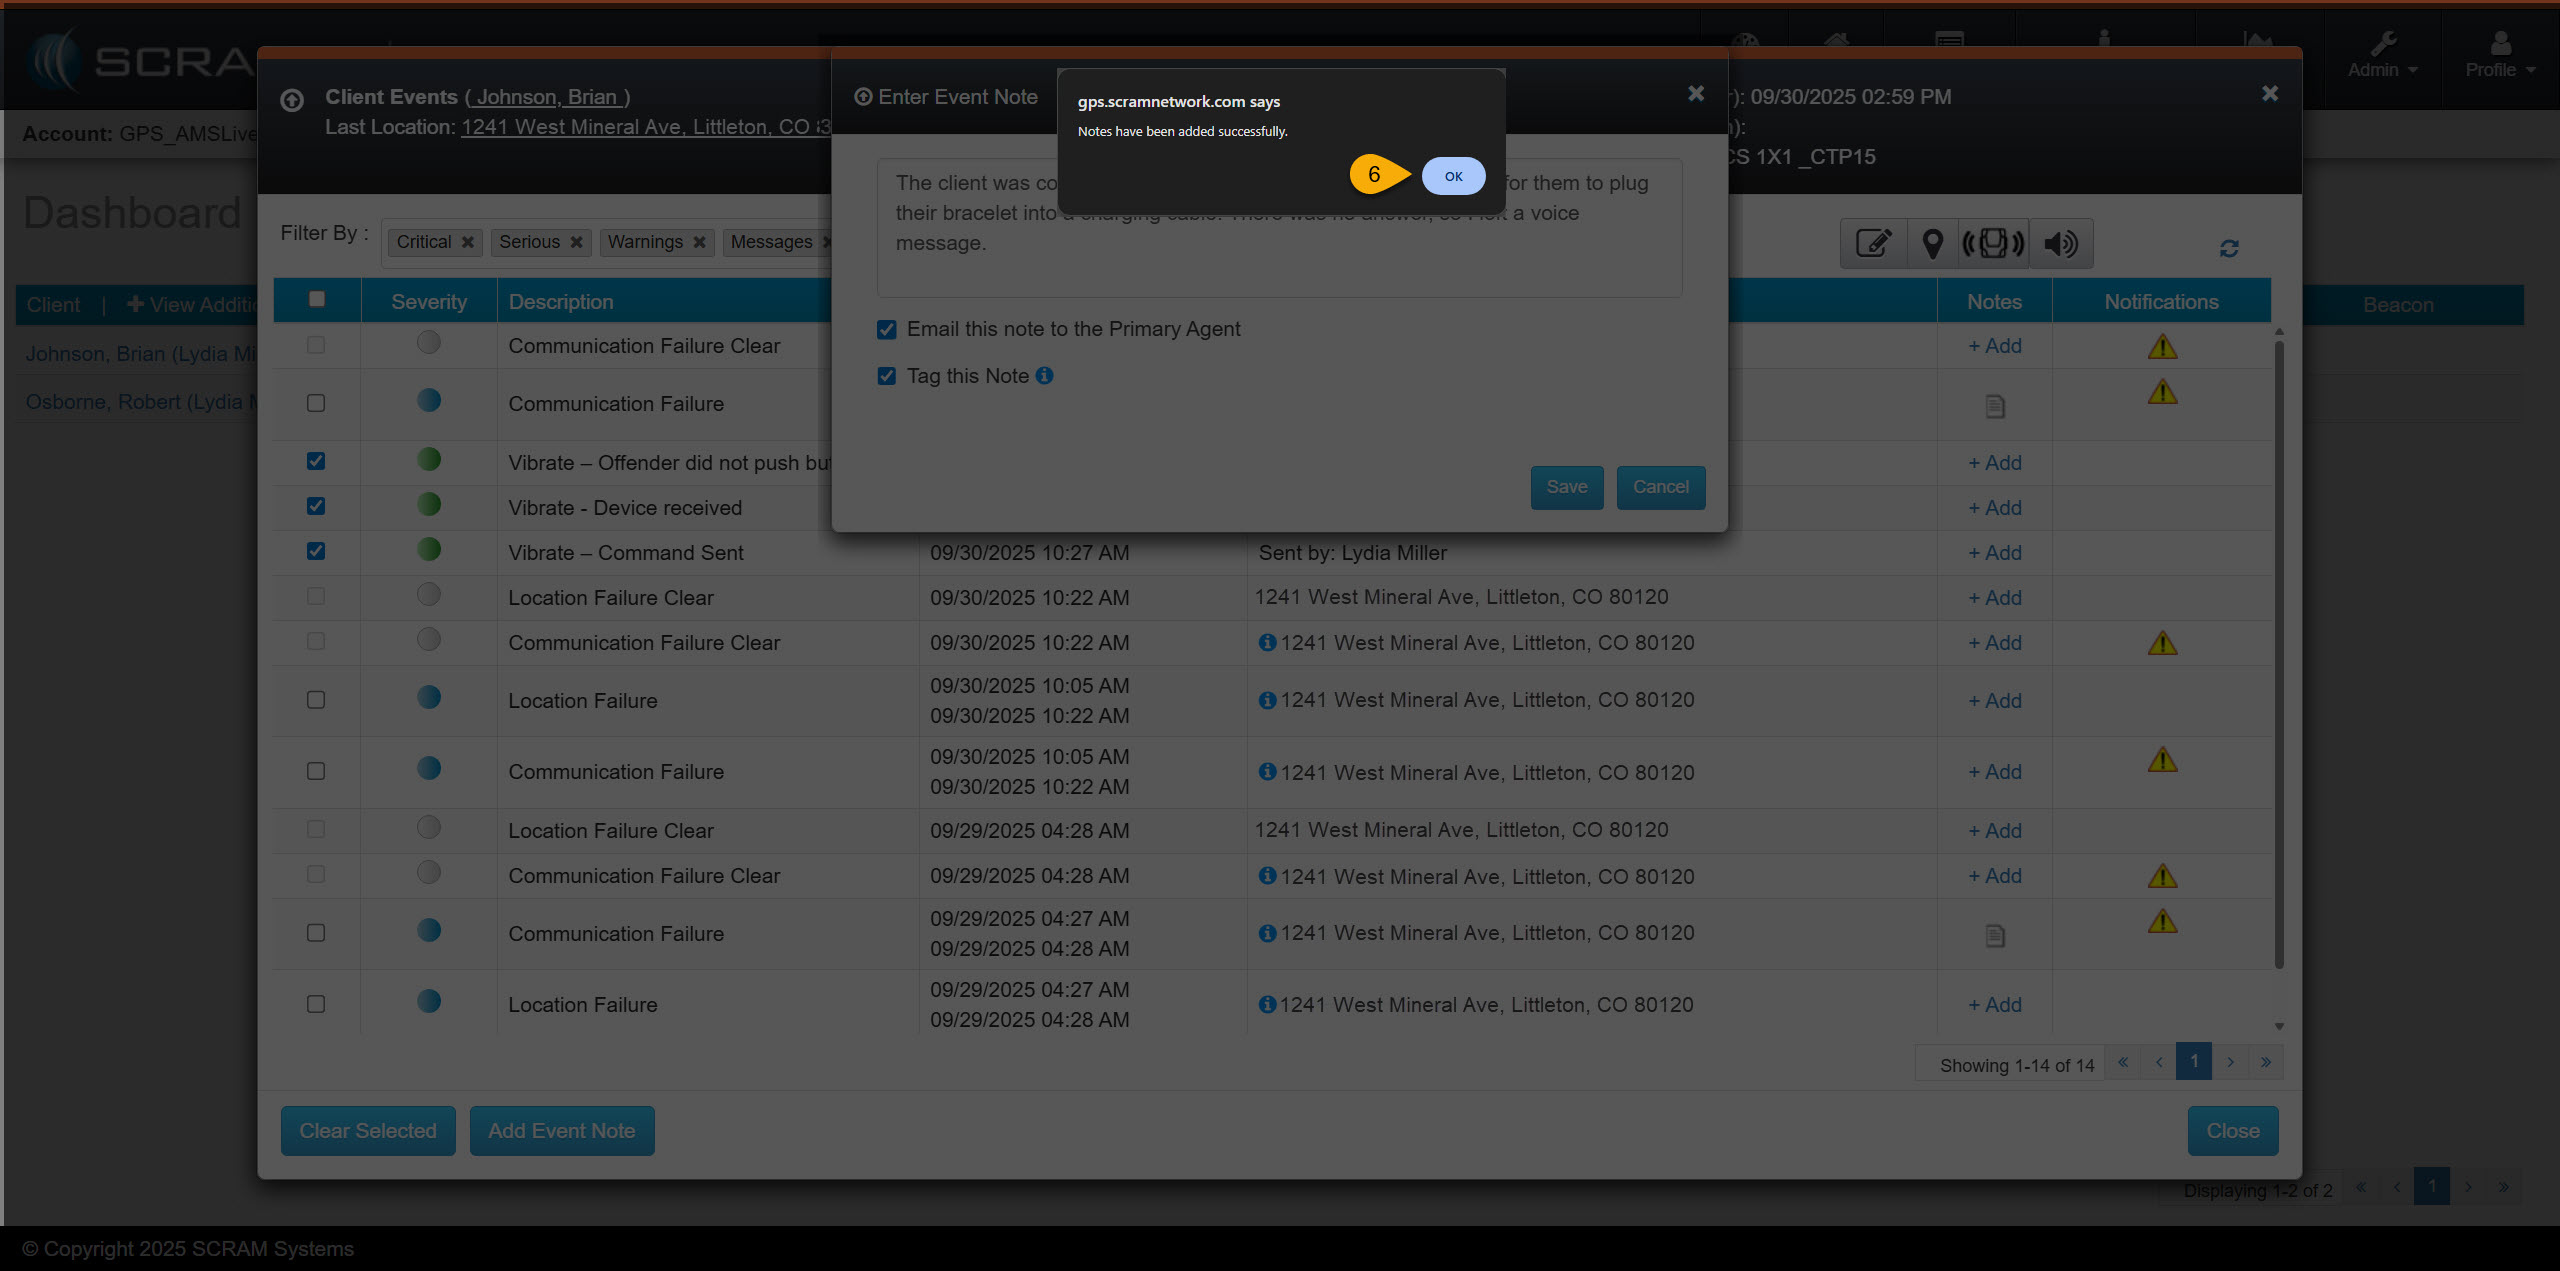
Acknowledgement pop-up Window – click to enlarge
To view a saved note, select the “page” icon next to the line item on the Client Events pop-up window, or next to the event notification on the Dashboard when applicable.
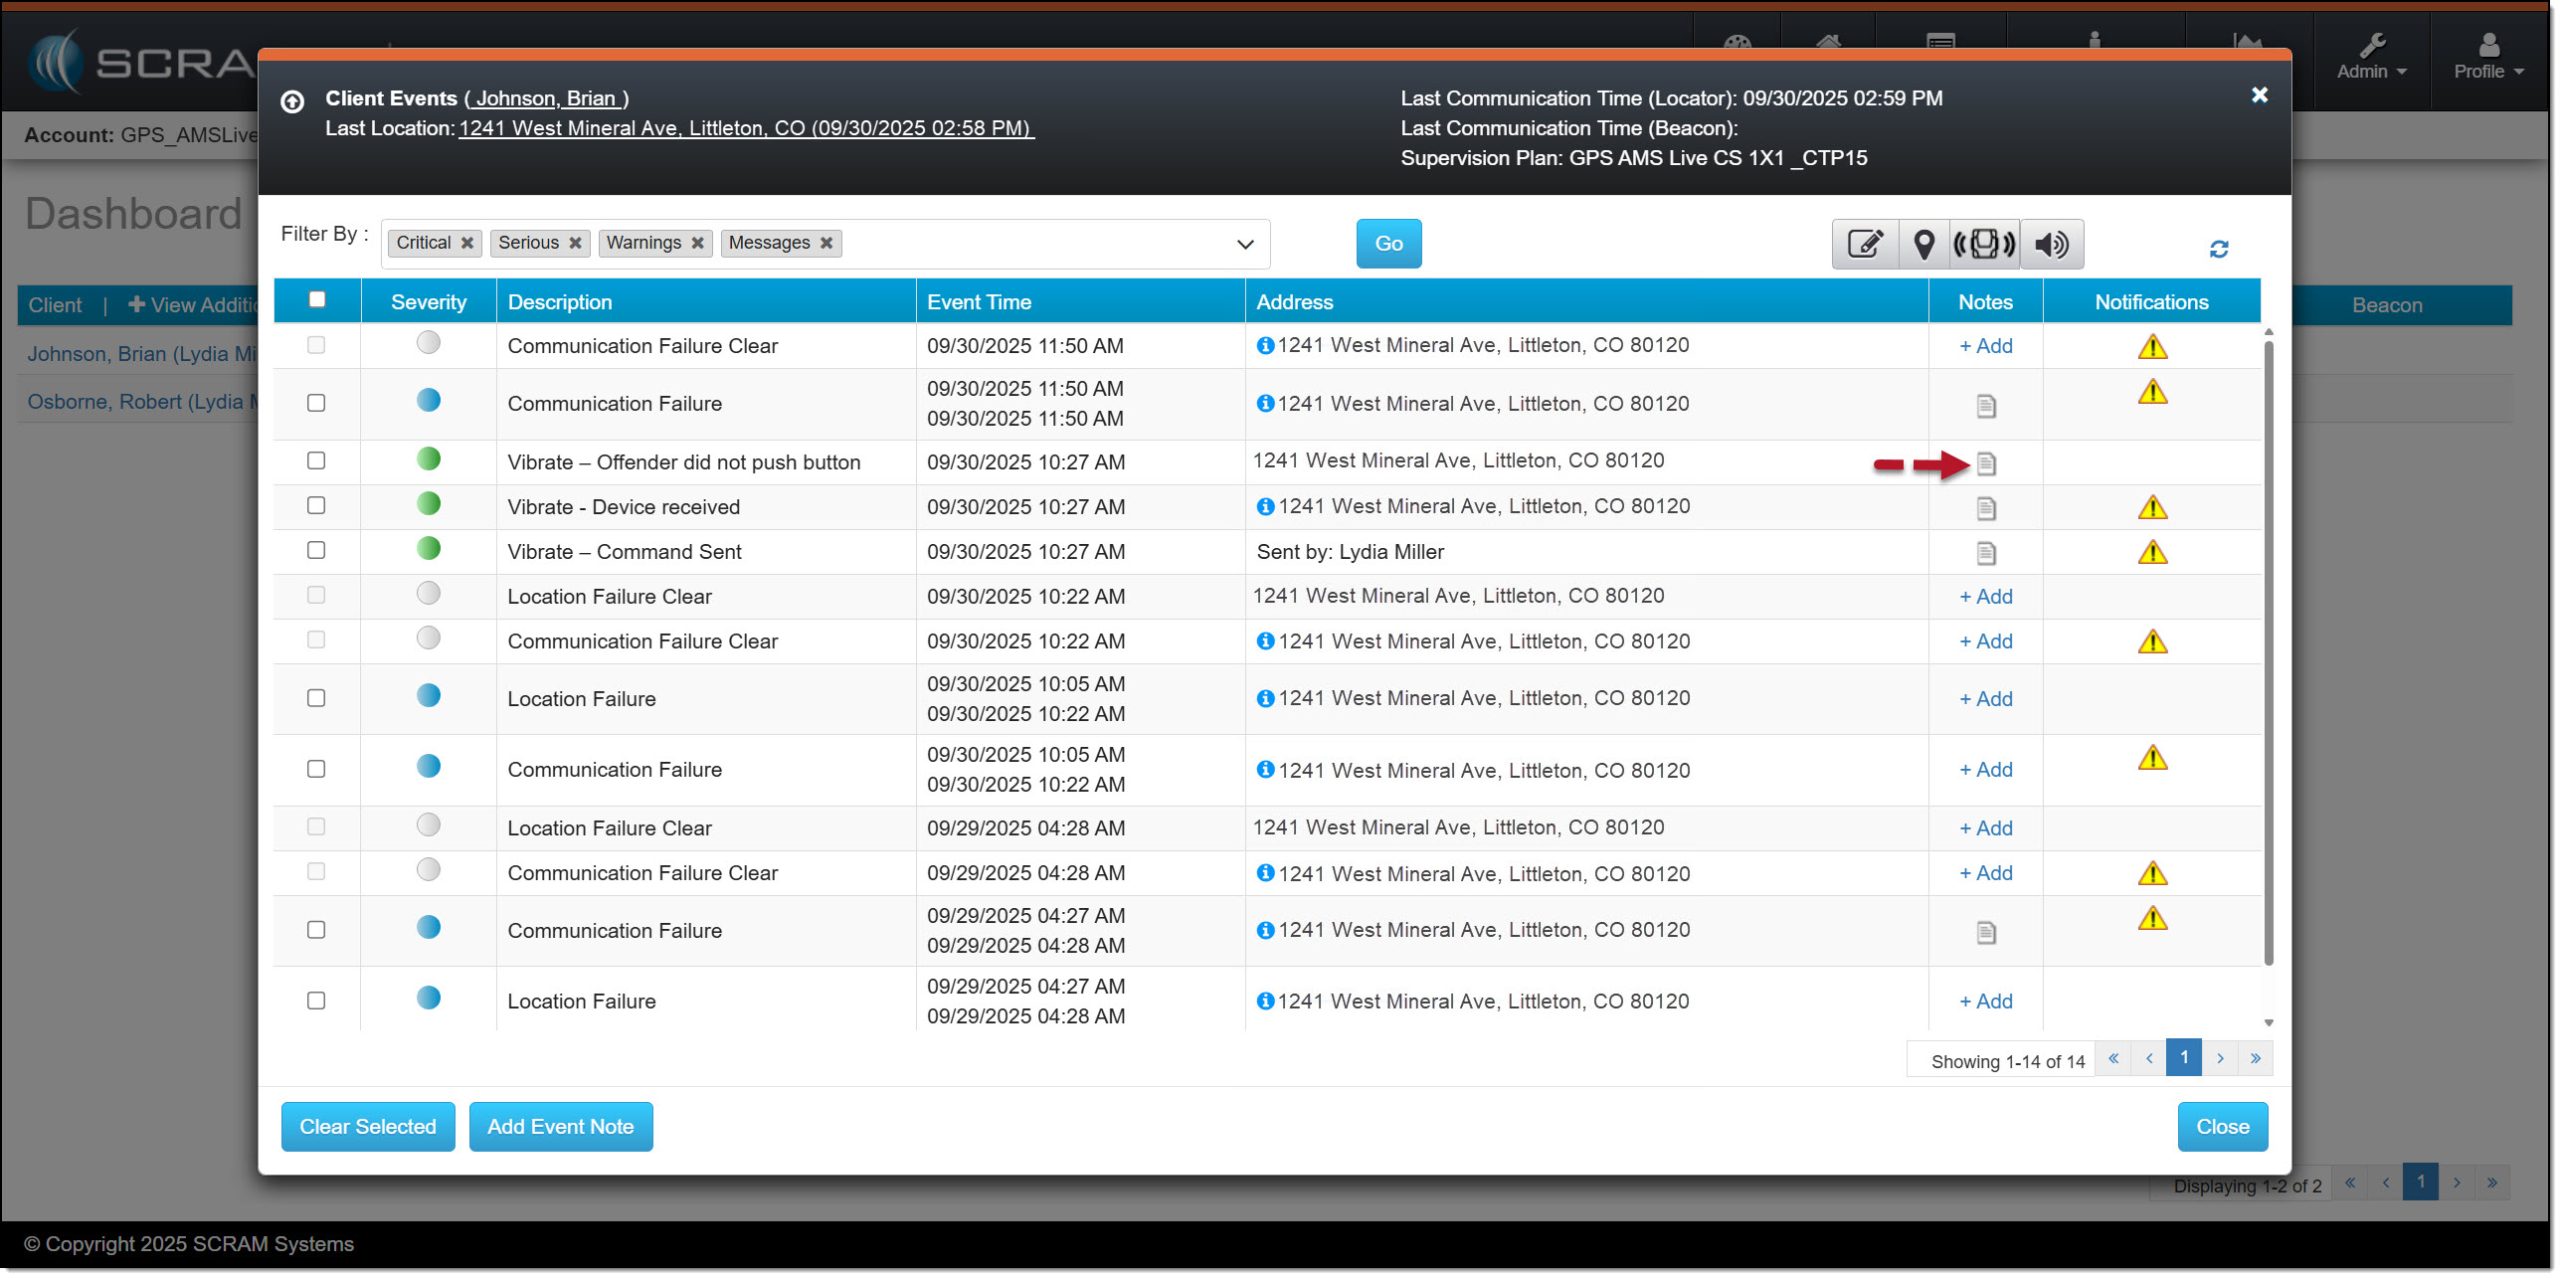
Notes Column with “Page” Icon – click to enlarge
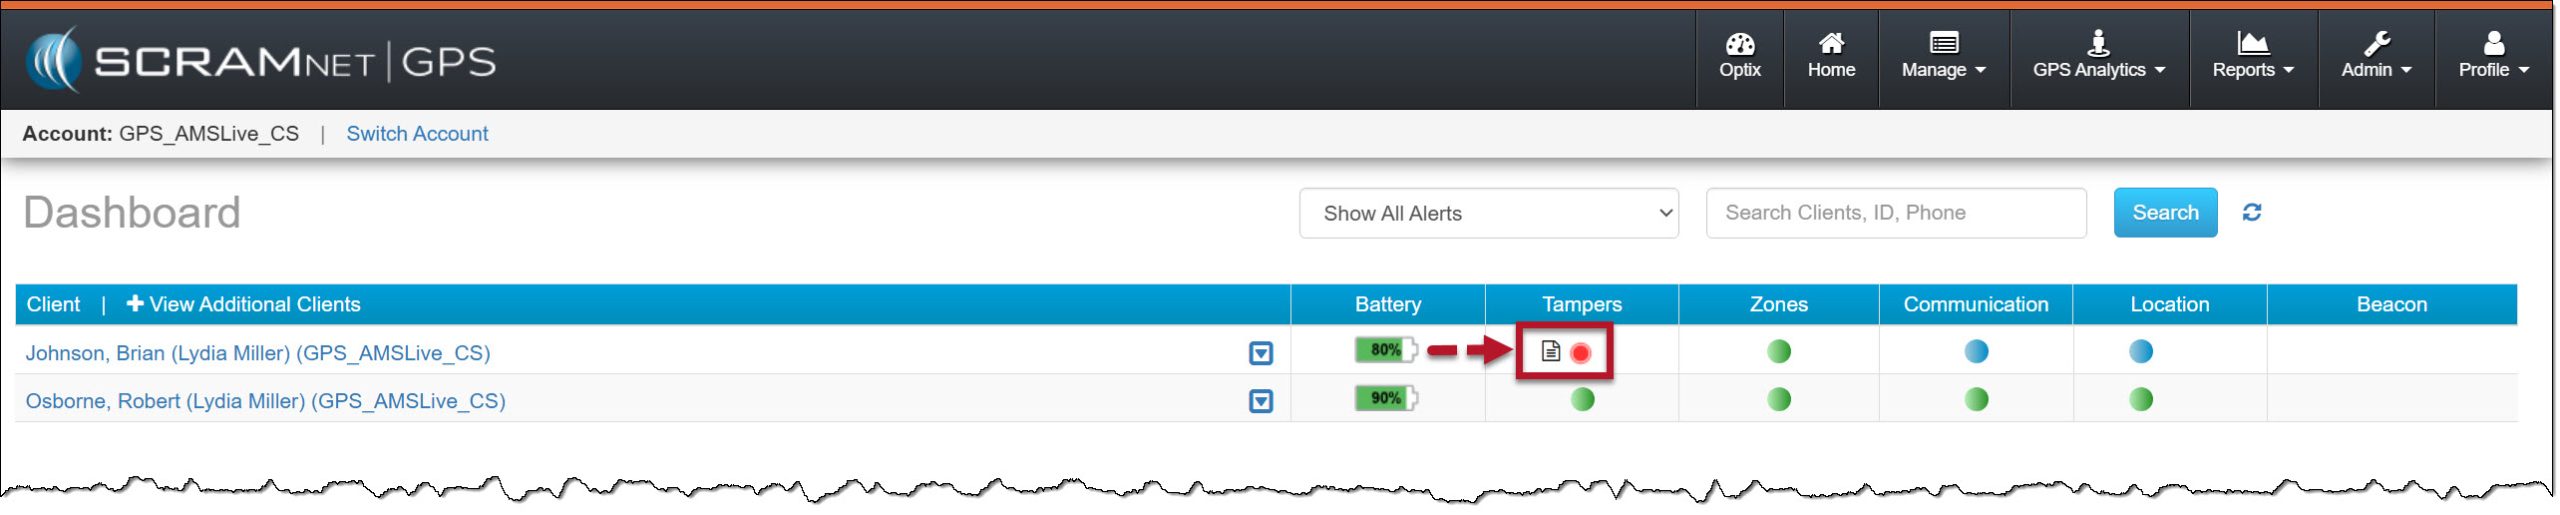
SCRAMNET GPS Dashboard, “Page” Icon Highlighted – click to enlarge
Clear an Event
Depending on your caseload settings, some event types may clear automatically from the Dashboard, while others require you to clear the event manually. Before removing any event from the Dashboard, ensure that the reason the event was generated has been resolved. For example, if the device has generated a Device Tamper event, and a Device Tamper Clear event has also been received from the bracelet, or when a zone violation occurs, and the client has either exited or entered the zone as required. The steps you take to resolve an event should be aligned with your program’s process and procedures.
On the Client Events pop-up window:
- Check the box next to the line item or items you wish to clear from the Dashboard.
- After making your selections, select the Clear Selected button.
Selected Events to Clear From Dashboard – click to enlarge
| Quick Tip
When you select multiple line items, the same note will be added to each line item chosen. |
- On the Enter Event Note pop-up window, add any information for this event. This may include steps taken to clear the event, client details, or other information.
- You may elect to send an email to the Primary Agent and “tag this note,” which will add a “page” icon next to the event notification on the Dashboard when applicable by checking the box to the left of each option.
- To save the information, select the Save button.
Example Note and Optional Items Checked – click to enlarge
- The last step is to select the OK button.
Acknowledgement Pop-up Window for Clearing Events – click to enlarge
Cleared Events on the Clients Events Pop-up Window – click to enlarge
The events is no longer displayed on the Dashboard.
SCRAMNET GPS Dashboard Events Cleared – click to enlarge
To view the cleared event, select the “Cleared” filter option described in the “Filtered By” section above.
Client Events Pop-up Window with Cleared Filter Selected – click to enlarge