The Optix Dashboard displays a series of tiles and tabs that provide consolidated views and reporting for your entire program. Each tile provides a quick view into the number of Active Clients currently under your Electronic Monitoring (EM) program or are utilizing the TouchPoint Client Check-In or Messaging services, as well as the number of Open Alerts that require your attention.
Customize the order in which the tiles appear on the page by right clicking and dragging the tile to the new location on the page.
Click the Active Clients hyperlink to navigate directly to that specific software application or click the Open Alerts hyperlink to navigate directly to the Alerts tab in Optix.
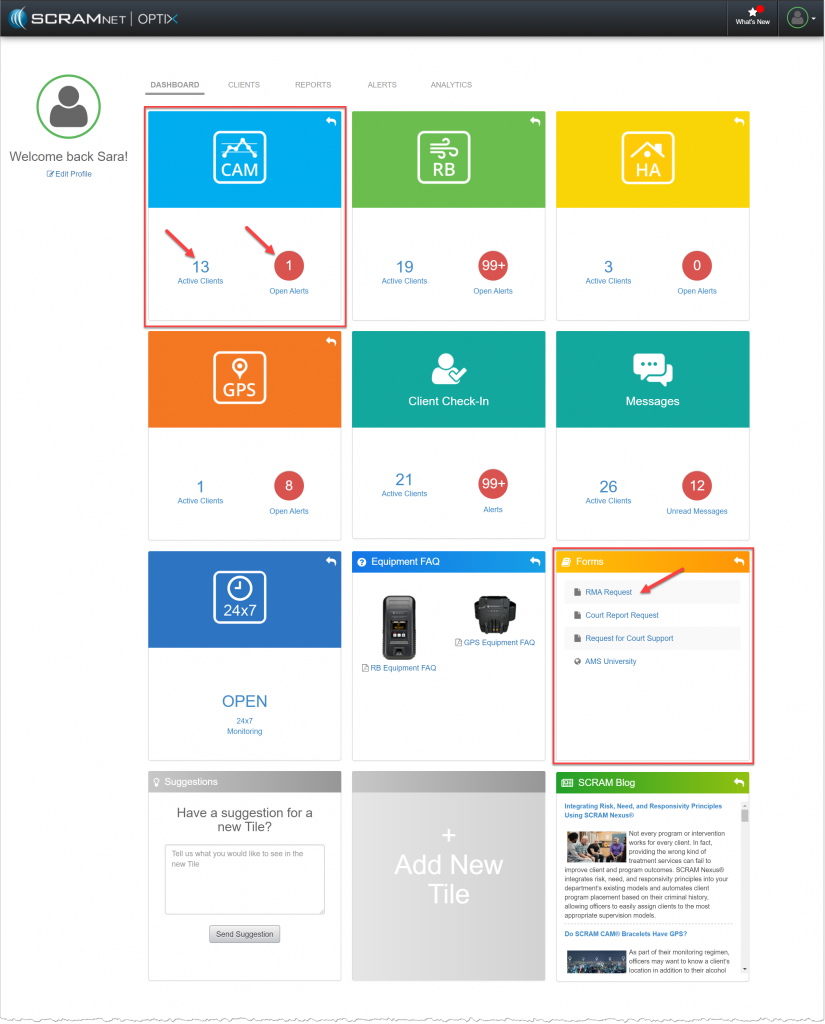
OPTIX Dashboard (click to enlarge)
Additional tiles available on the Dashboard include:
- The Forms Tile: Quick links to some of the most commonly used support requests.
- The SCRAM Blog Tile: A spotlight of important industry articles.
- Suggestions Tile: Provide us your feedback and any improvements you would like to see to the systems or products that will help your program run more efficiently.
- +Add New Tile: Add additional available tiles to your Dashboard.
- Equipment FAQ Tile: Helpful troubleshooting for Remote Breath and GPS equipment.
Evidence and Criteria Based software programs tiles include:
- SCRAM 24/7
- NEXUS