The Optix Analytics – GPS reports are designed to help you enhance your overall program by providing you with information on your client demographics, your compliance percentage, the amount and types of alerts that are being generated for your agency, and the average amount of days clients are on the program before the first alert is generated. Each report can be filtered to focus the data being displayed on each tile. This allows you to pinpoint the desired information and take a deeper dive into the data that are important to you.
The four GPS reports available are:
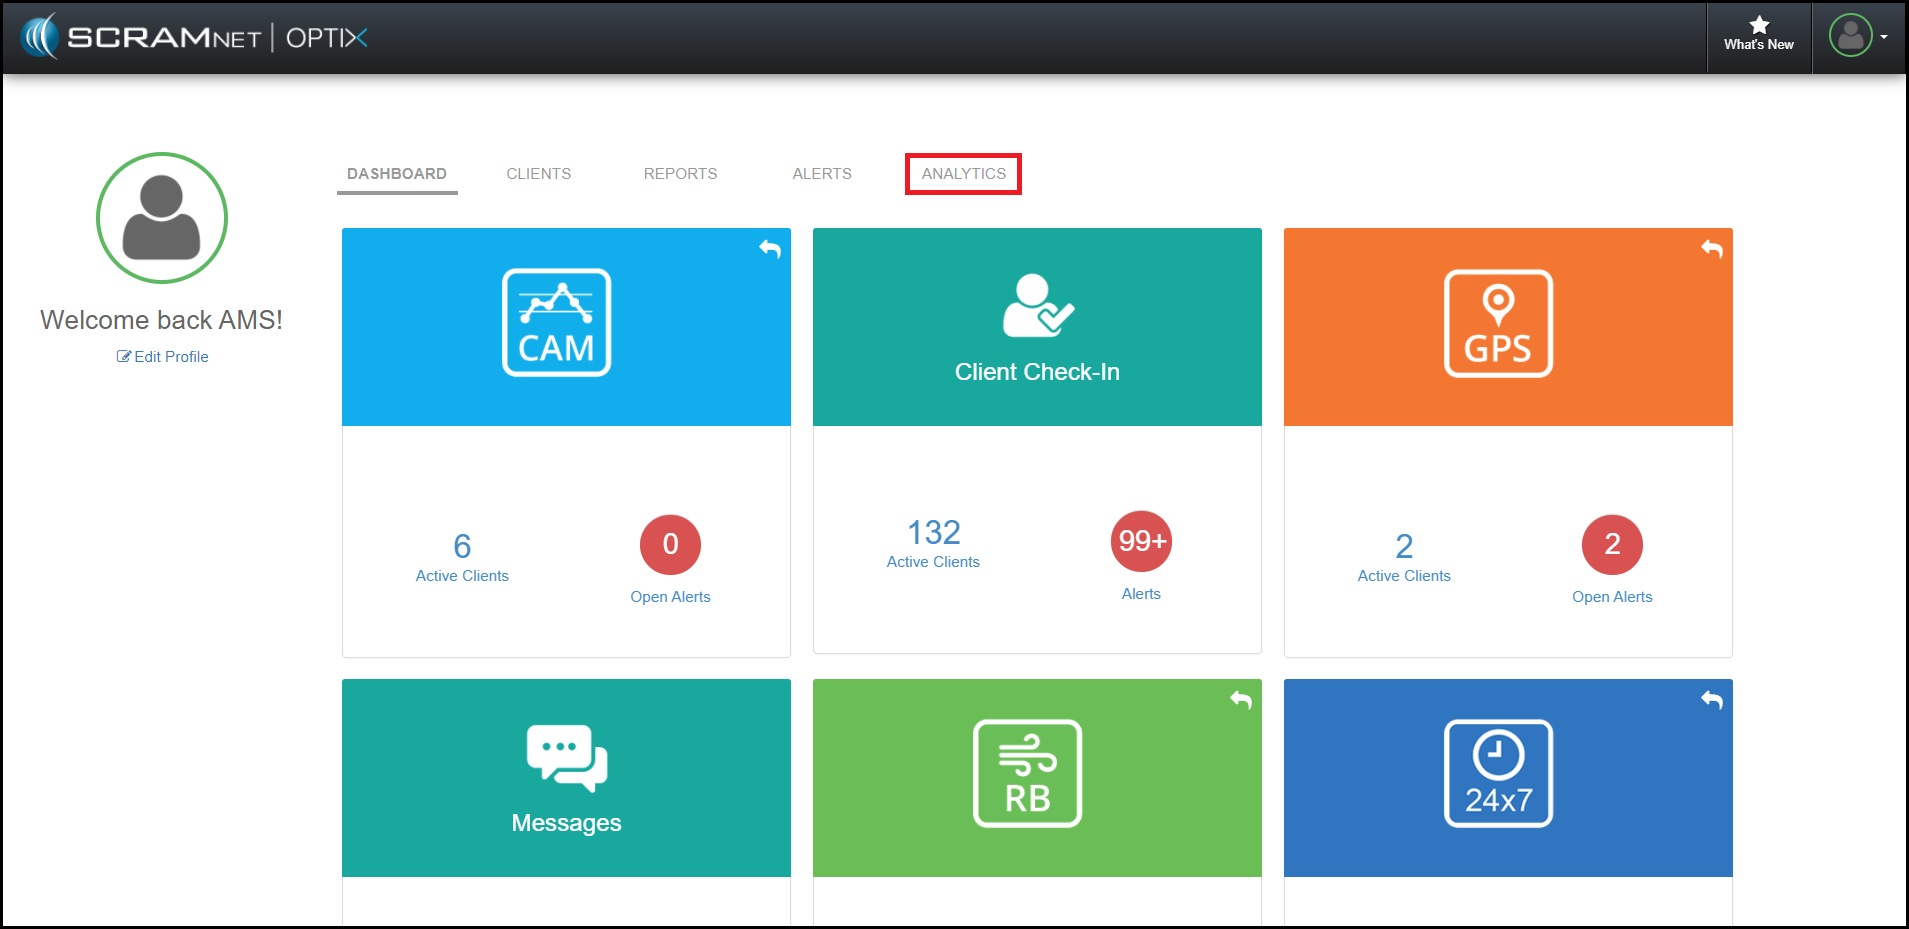
To access these reports, navigate to the Analytics tab from within Optix.
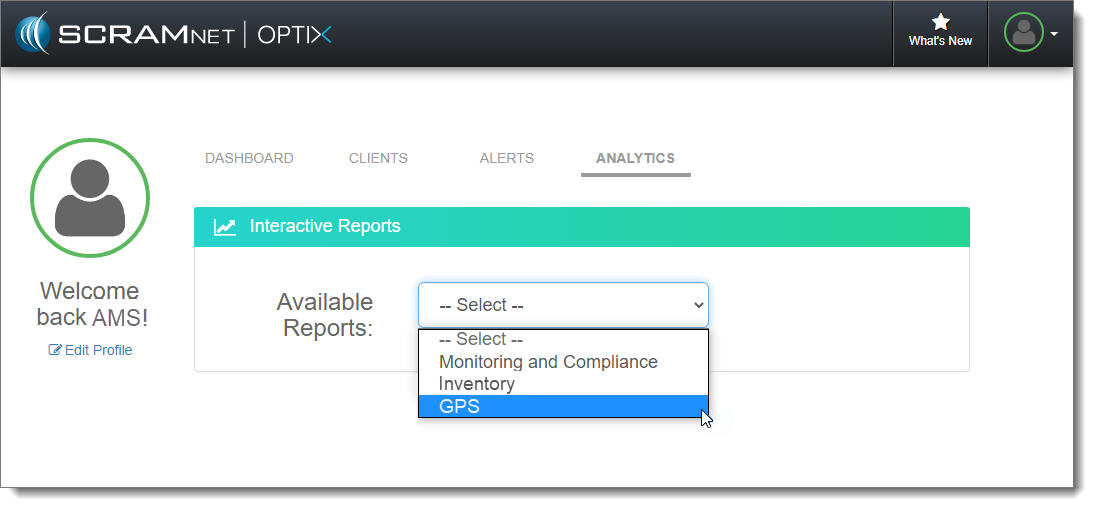
Next, select the GPS option in the Available Reports dropdown menu.
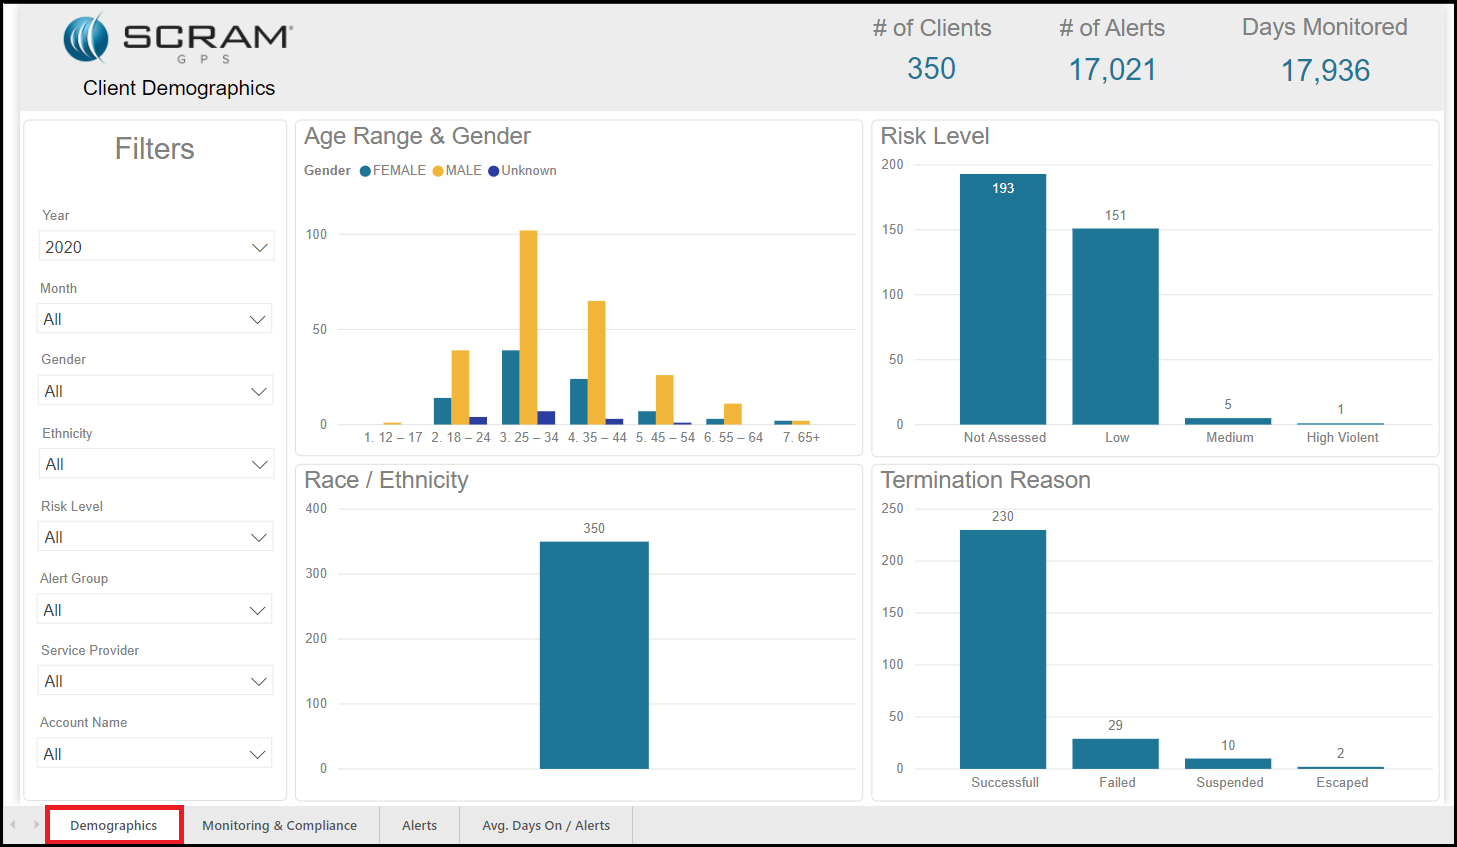
Client Demographics Report
The Client Demographics report displays the demographic information for your agency caseloads. This report provides the following information:
- Age Range and Gender: This tile displays age ranges and gender types.
- Risk Level: This tile displays the number of clients per risk level.
- Race / Ethnicity: This tile displays the number of clients per ethnicity type.
- Termination Reason: This tile displays the number of clients that were terminated per termination reason.
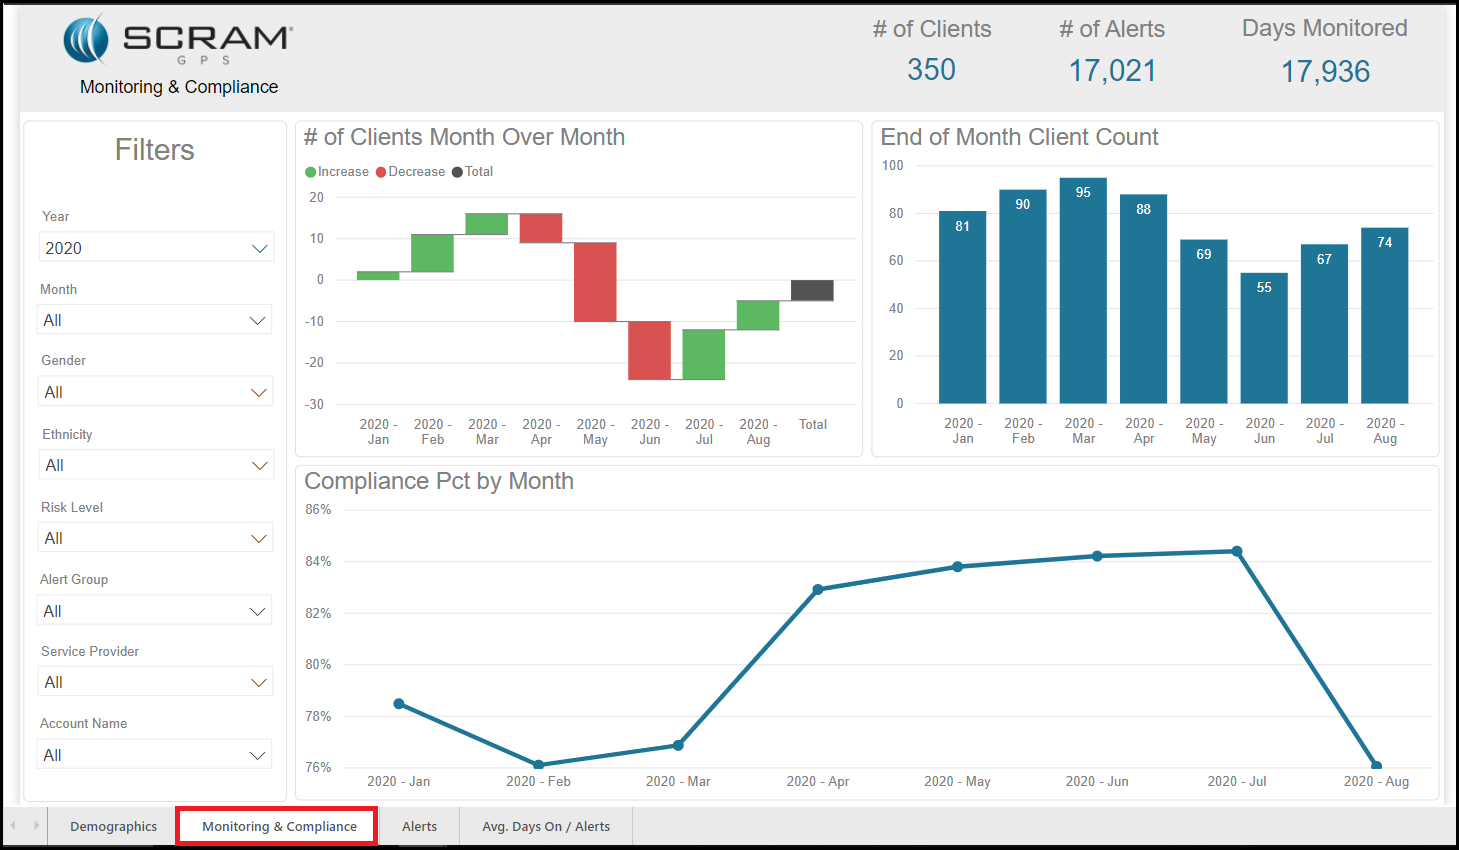
Monitoring and Compliance Report
The Monitoring & Compliance report displays the number of clients on your program at the end of each month. It allows you to track the changes to the number of clients and compliance rates from month to month.
The tiles displayed are:
- Number of Clients Month over Month: This tile displays the increase or decrease in monitored clients month to month.
- End of Month Client Count: This tile displays the number of clients on the last day of the month by monitoring type.
- Compliance Percent: Compliance percentage by month. (Example: 99% of clients were compliant for the month).
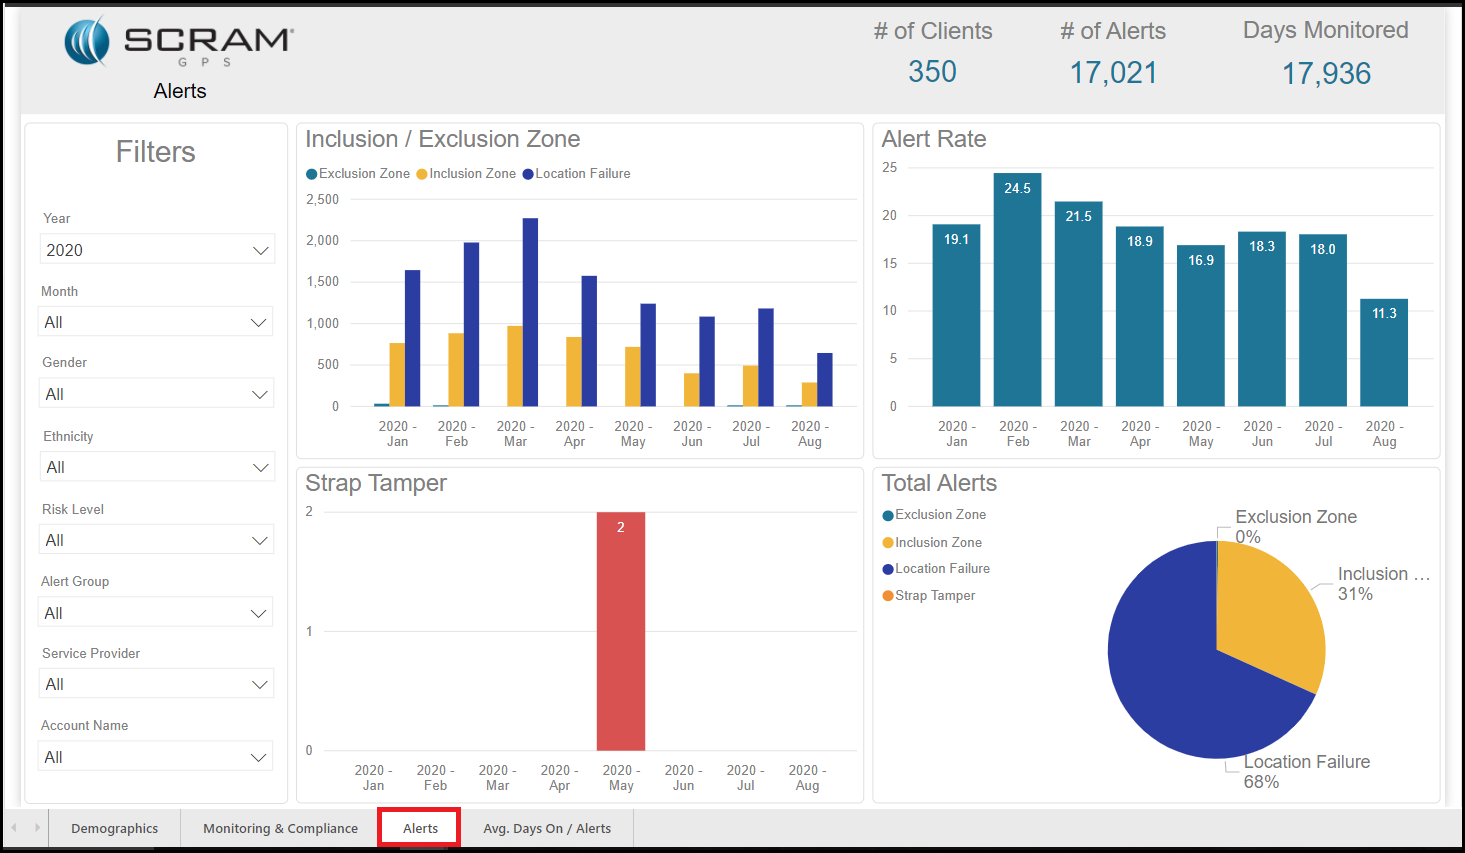
Alerts Report
The Alerts report displays the number and types of alerts that were generated for a specific period of time.
The tiles displayed are:
- Inclusion / Exclusion Zone: This tile displays the number of inclusion and exclusion alerts that were generated.
- Alert Rate: This tile displays the frequency of alerts.
- Strap Tamper: This tile displays the number of strap tampers.
- Total Alerts: This tile displays the total number alerts by alert type.
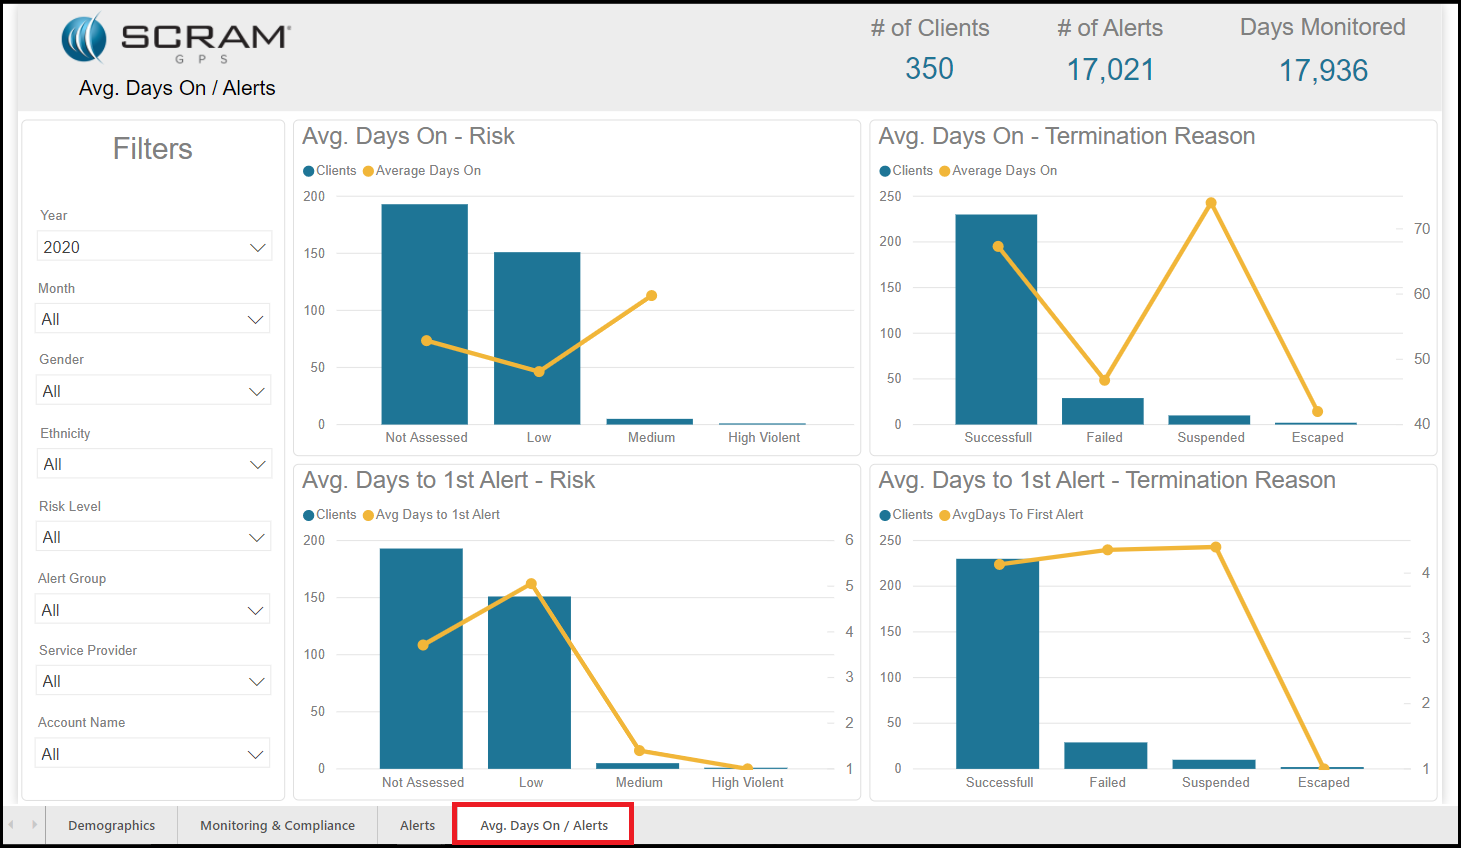
Average Days On / Alerts Report
The Average Days On / Alerts report presents the average number of days on the program as compared to risk and the termination reason.
The tiles displayed are:
- Average Days On – Risk: This tile displays the average amount of days on the program per risk level.
- Average Days On – Termination Reason: This tile displays the total number of days on the program per termination reason.
- Average Days to 1st Alert / Risk: This tile displays the average number of days to the first alert as compared to risk level.
- Average Days to 1st Alert / Termination Reason: This tile displays the average number of days to the first alert as compared to termination reason.