The Analytics tab on the SCRAM Optix dashboard provides you with a wealth of interactive data visualizations that display client and program activity and performance statistics for your department’s usage of SCRAM technology. Based on your licensed products, a series of report templates may be accessed via the Available Reports dropdown menu. Check back often – new reports are being added all the time!
Use the filters provided for each report to dynamically update the information displayed on each tile, or click on the data displayed within the tile for a more focused analysis. Within each tile an information icon provides an explanation of the data displayed.
The available suites of reports include:
- Inventory Reports
- Monitoring and Compliance Reports
- 24/7 Monitoring and Compliance Reports
- GPS Analytics
- TouchPoint Analytics
- Nexus Analytics
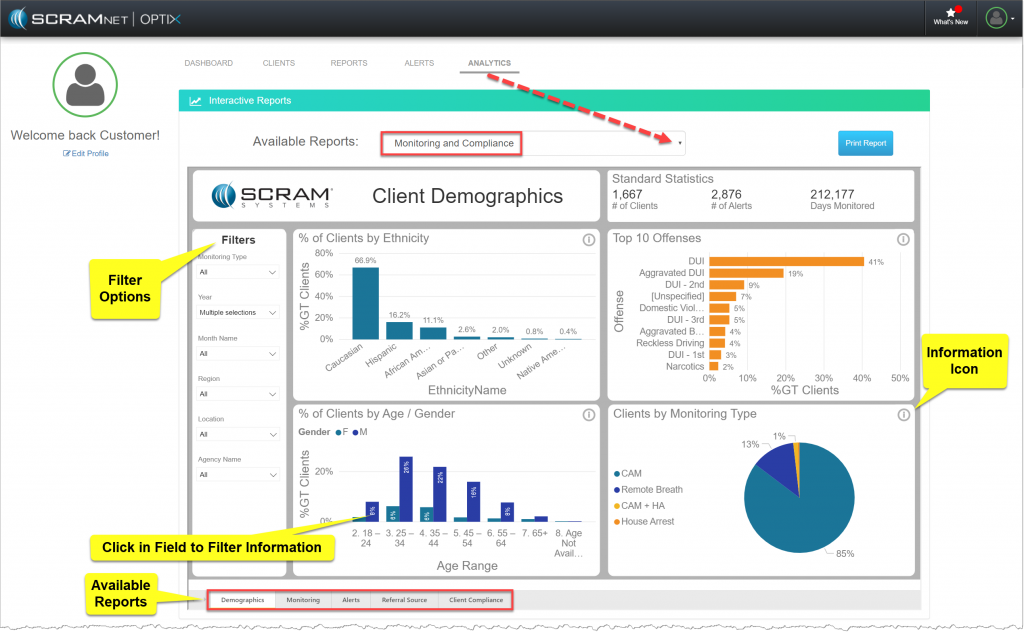
Optix Analytics Reports page (click to enlarge)
The data represented in the Analytics reports represent the information synced as of midnight the prior day. Microsoft’s PowerBI provides the underlying reporting and data visualization interface.