The Monitoring and Compliance reports are designed to help you optimize your monitoring program by providing detailed data on the types of clients you are monitoring, the referring authorities, the types of alerts being generated, and client compliance success. This information may help you to evaluate your business operation and identify areas for growth and improvement. Use the filters provided for each report to dynamically update the information displayed on each tile, or click on the data displayed within the tile for a more focused analysis. Within each tile an information icon provides an explanation of the data displayed.
The five Monitoring and Compliance reports available are:
To access these reports, navigate to the Analytics tab from within Optix.
Next, selected the Monitoring and Compliance option on the Available Reports drop-down menu.
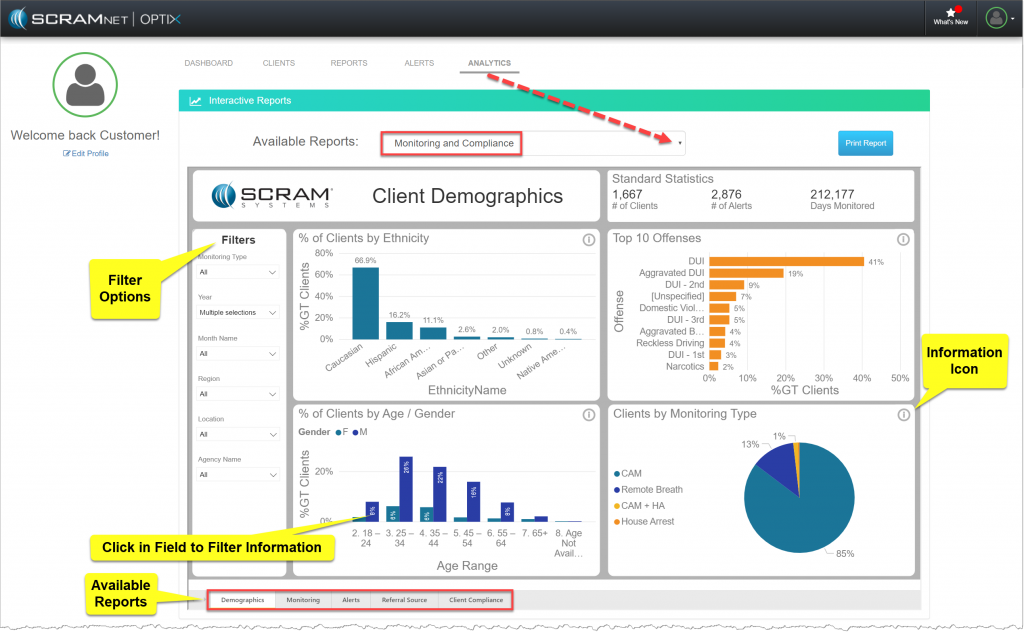
Analytics Monitoring and Compliance Reports (click to enlarge)
Client Demographics Report
The Client Demographics report displays the personal and population-based information of the clients on your program, as well as the assigned monitoring technology.
The tiles displayed are:
- % of Client by Ethnicity: Percentage of clients by Ethnicity.
- % of Clients by Age/Gender: Percentage of clients by age and gender.
- Top 10 Offenses: Percentage of clients by offenses (top 10).
- Clients by Monitoring Type: Percentage of clients by monitoring type.
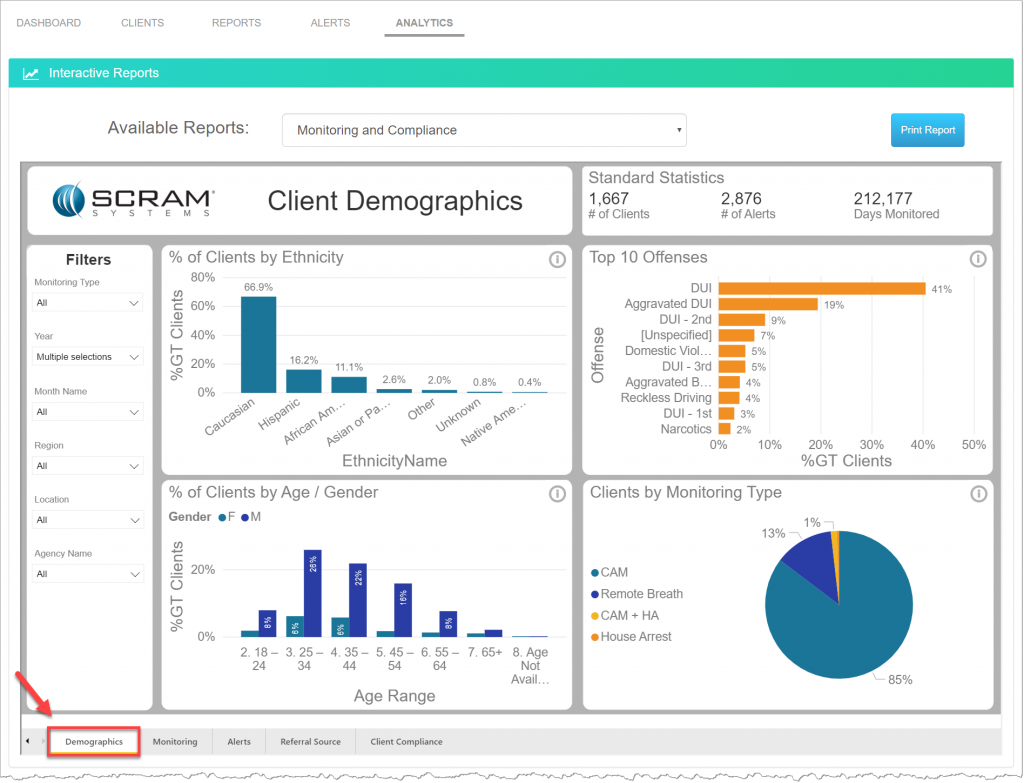
Analytics Monitoring and Compliance Reports – Demographics (click to enlarge)
Monitoring & Compliance Report
The Monitoring & Compliance report displays the number of clients on your program at the end of each month. It allows you to track the changes to the number of clients and compliance rates from month to month.
The tiles displayed are:
- Diff Prev Month by Month Name: Increase or decrease in monitored clients month to month.
- Compliance Percent: Compliance percentage by month. (Example: 99% of clients were compliant for the month).
- End of Month Client Count: Number of clients on the last day of the month by monitoring type.
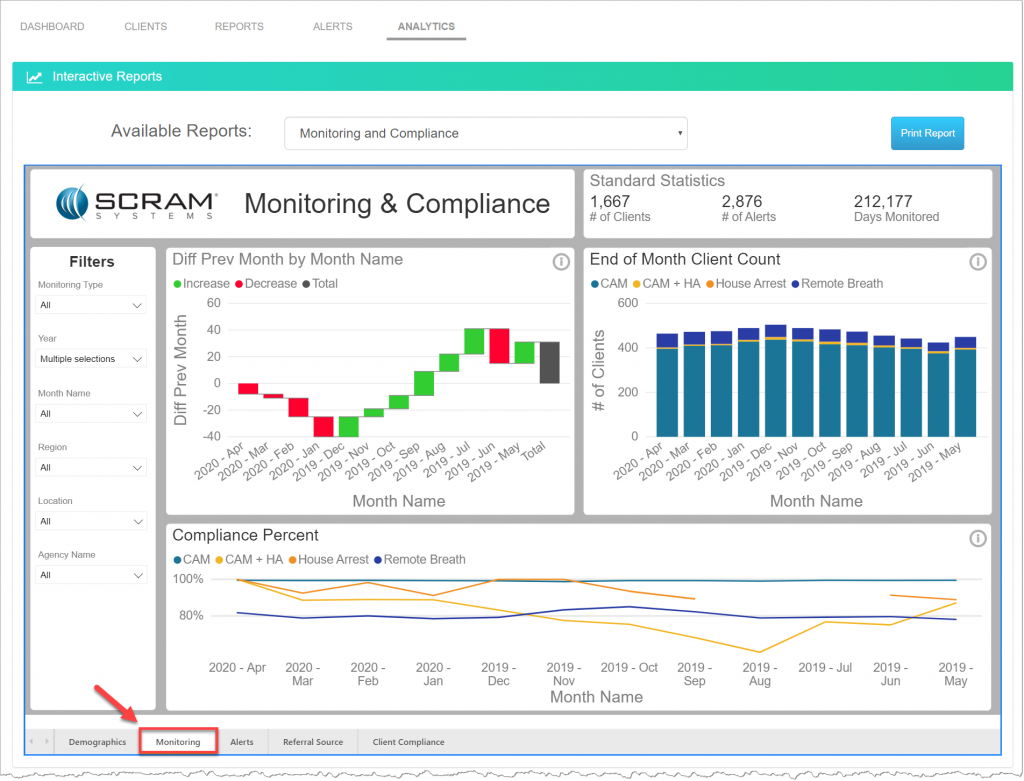
Analytics Monitoring and Compliance Reports – Monitoring (click to enlarge)
Alerts Report
The Alerts report displays the number of alerts generated across all monitoring types. Allowing you to trend the alerts generated by each monitoring type.
- Cam Alerts: Number of CAM alerts.
- RB Alerts: Number of Remote Breath Alerts.
- Total Situations by Monitoring Type: Percentage of alerts by monitoring type.
- House Arrest alerts: Number of House Arrest alerts.
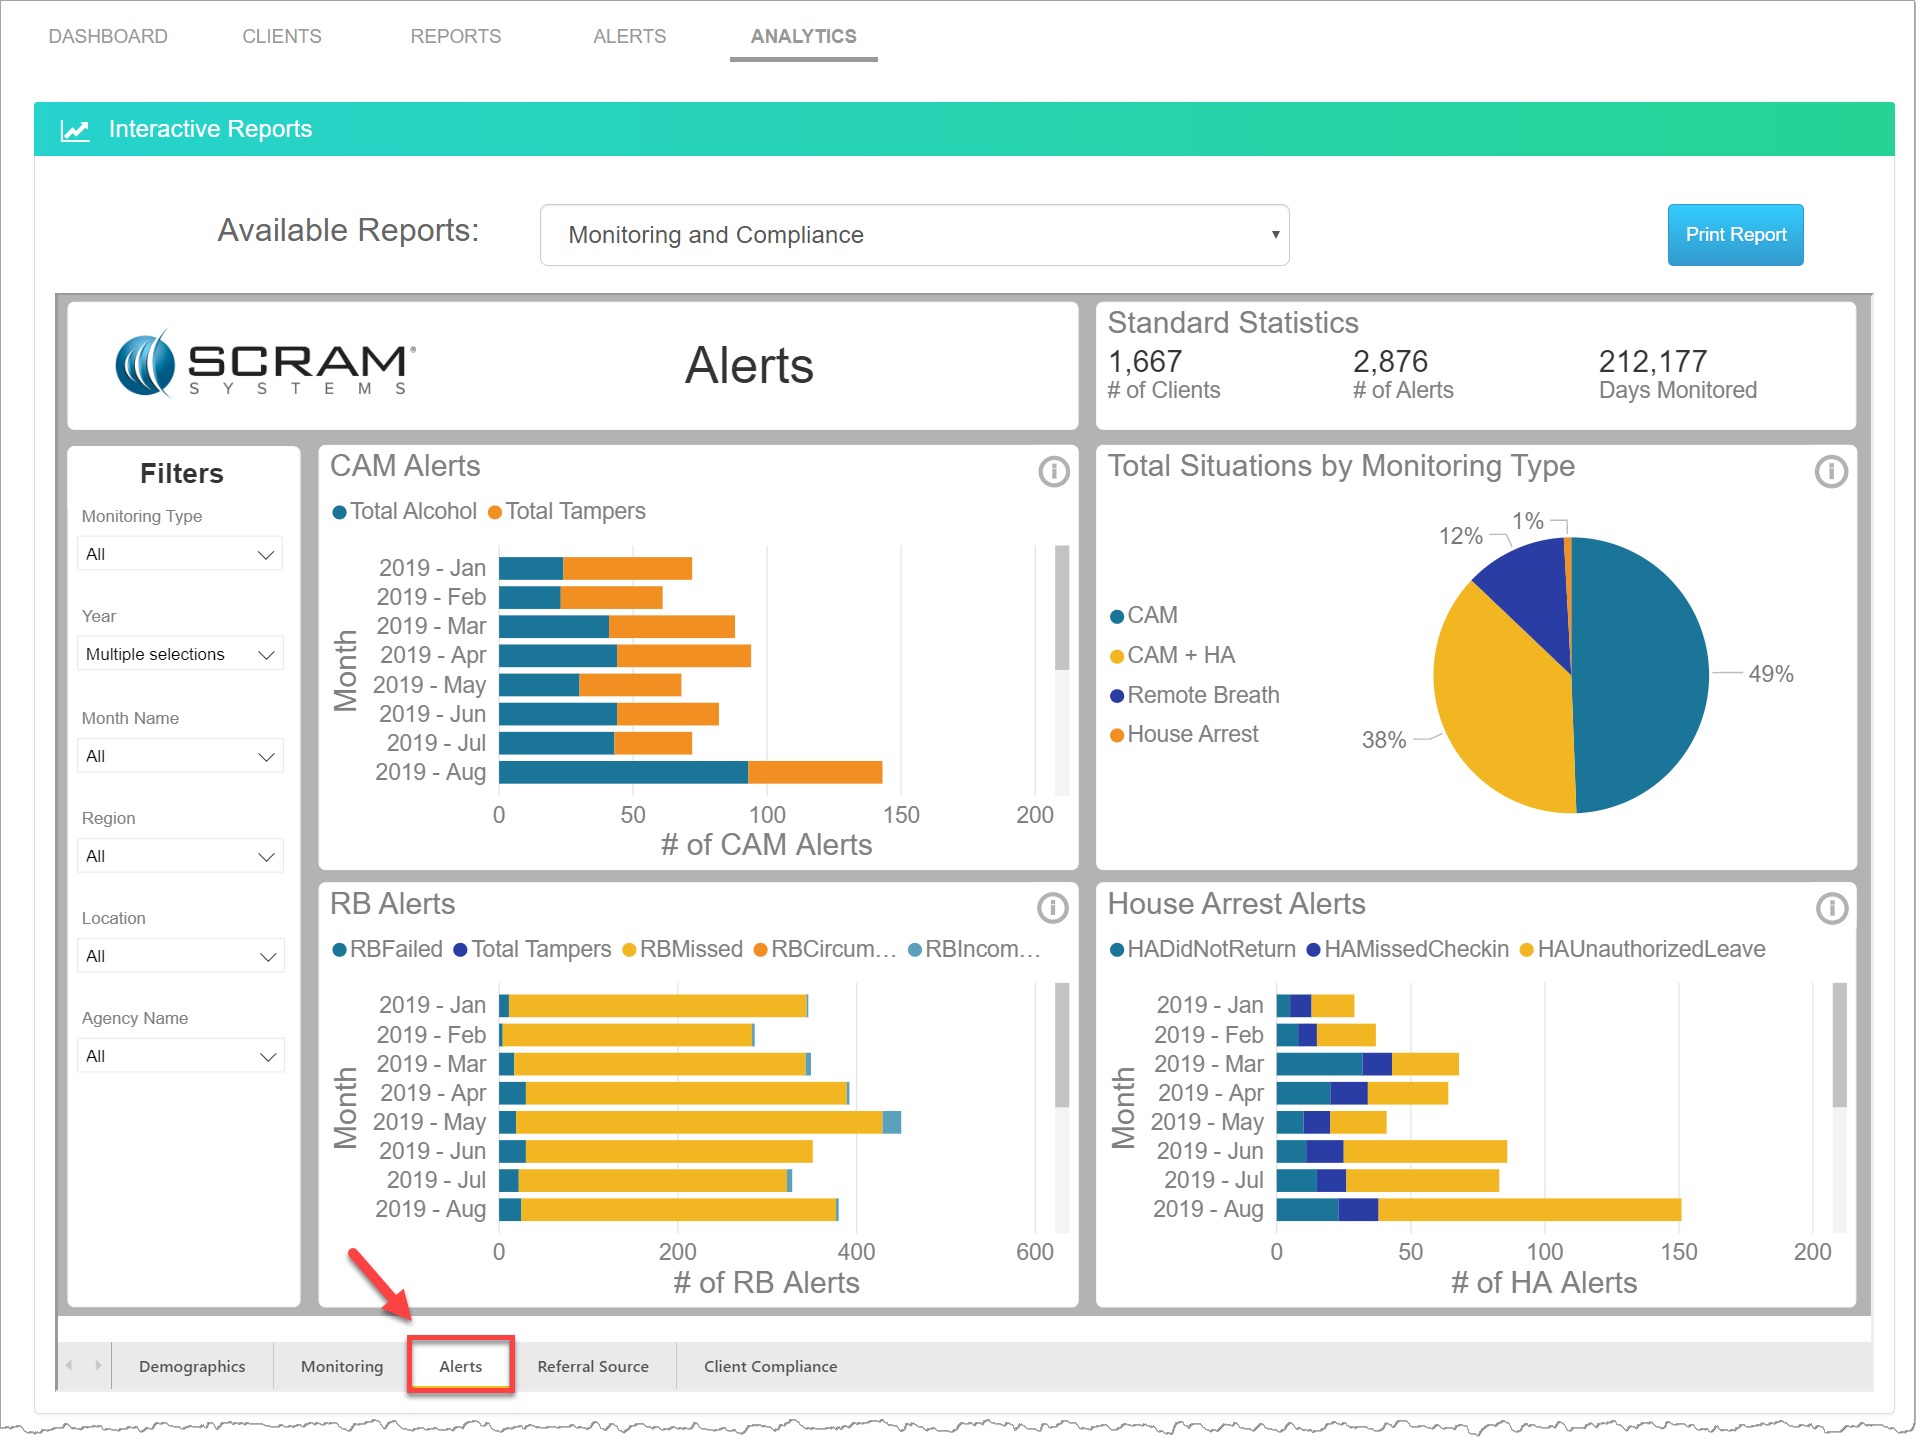
Analytics Monitoring and Compliance Reports – Alerts (click to enlarge)
Referral Source Report
The Referral Source report presents information about the referring authorities and sentencing time frames, as well as the offense types for the clients on your program.
- Clients and Avg Days on by Offender Type: Bar graph displays the number of clients by offender type. The line graph displays the average days with active monitoring by offender type.
- Clients and Avg Days on by Offense: Bar graph displays the number of clients by offense. The line graph displays the average days with active monitoring by offender type.
- Client by Court Specialty: Percentage of clients referred by court specialty (top 5 count of clients).
- Client by Court Name: Percentage of clients referred by specific courts (top 5 count of clients).
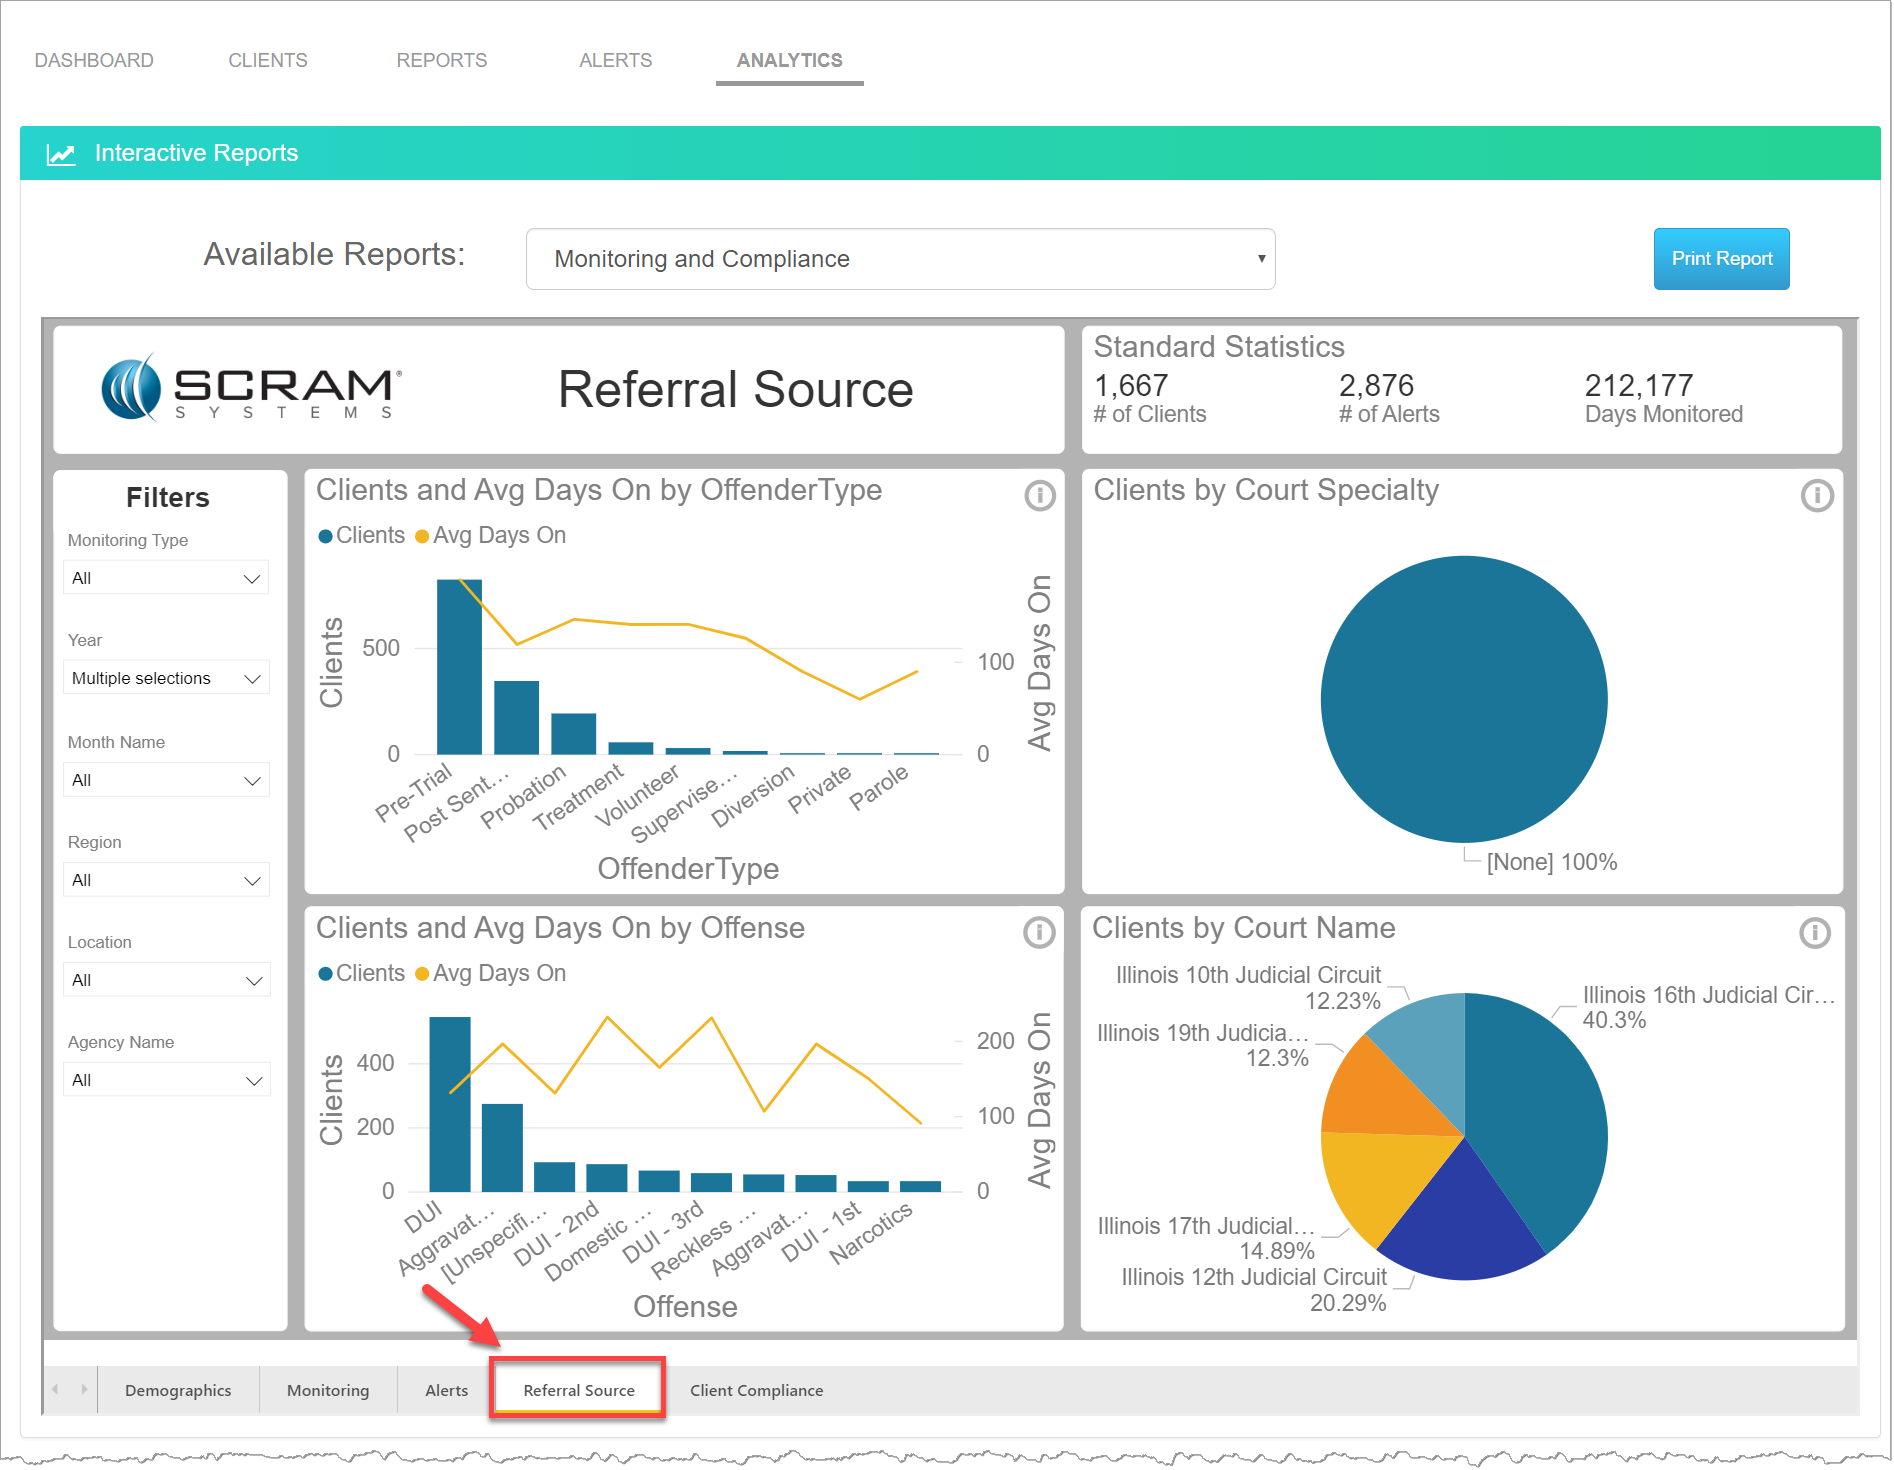
Analytics Monitoring and Compliance Reports – Referral Source (click to enlarge)
Client Compliance Report
The Client Compliance report trends the clients’ compliance and non-compliance over time, monitoring type and age.
- Alcohol Compliance Percentage of compliant vs. non-compliant clients by day range.
- Alcohol Compliance: Number of compliant vs. non-compliant clients by monitored day range and average number of violations.
- Alcohol Compliance: Average number of monitored days to first violation by age range and monitoring type.
- HA Compliance: Number of compliant vs. non-compliant clients by monitored day range and average number of violations.
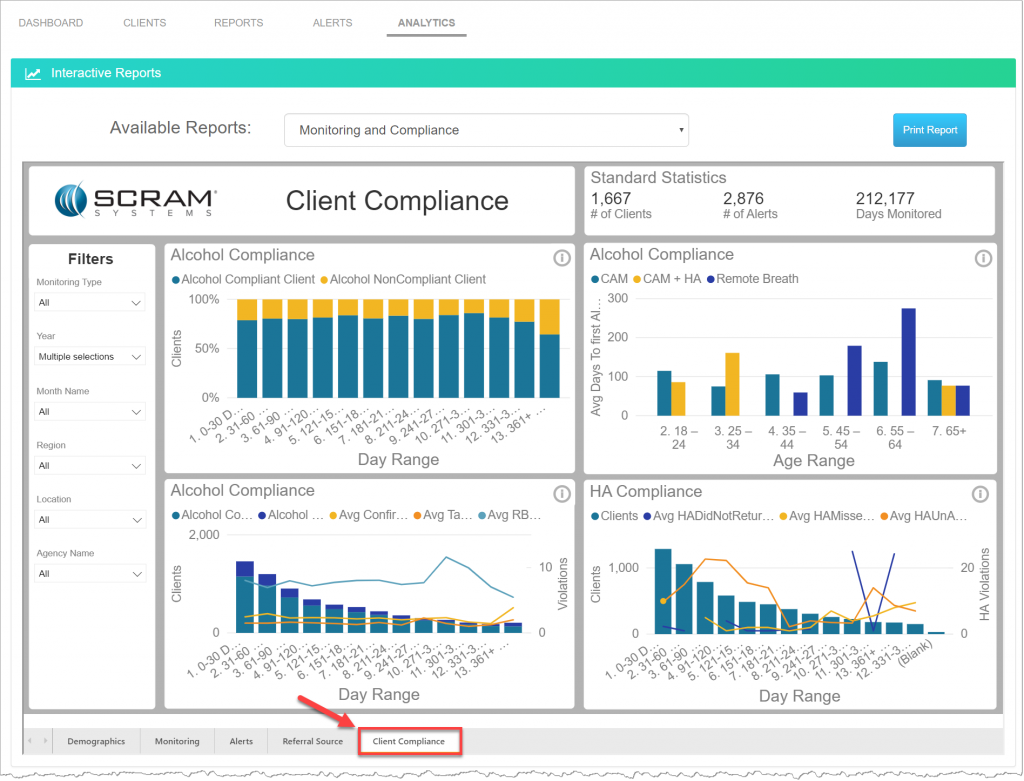
Analytics Monitoring and Compliance Reports – Client Compliance (click to enlarge)